 Global| Jun 14 2017
Business Sales Unchanged While Inventories Slipped in April
by:Sandy Batten
|in:Economy in Brief
Summary
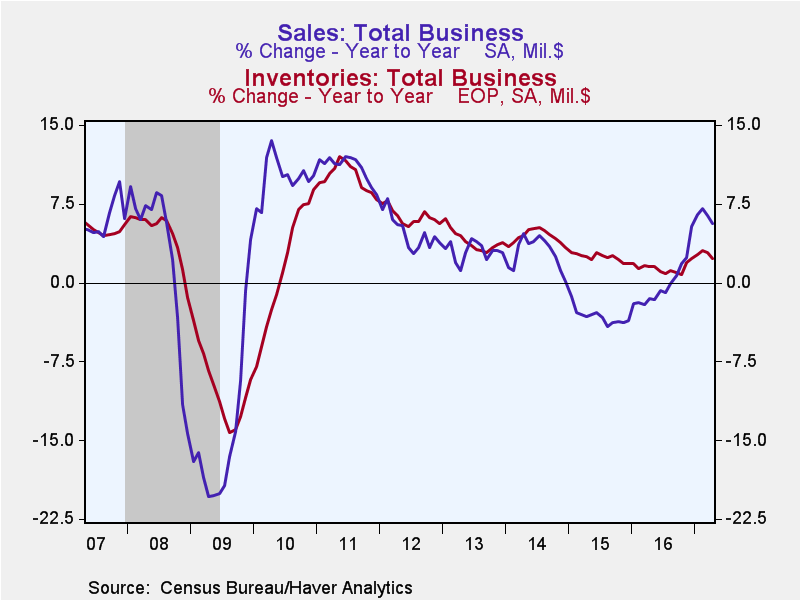
Business sales continued their modest cooldown in April after their stellar performance at the end of 2016. Sales were unchanged (5.6% y/y) in April from March following a downwardly revised 0.1% decline in March. For the major [...]
Business sales continued their modest cooldown in April after their stellar performance at the end of 2016. Sales were unchanged (5.6% y/y) in April from March following a downwardly revised 0.1% decline in March. For the major sectors, retail sales posted a solid showing in April, rising 0.5% (4.8% y/y) and a robust 0.5% m/m (5.0% y/y) after auto sales are excluded. In contrast, wholesale sales fell 0.4% m/m (+7.3% y/y) in April on top of a 0.2% m/m decline in March. Manufacturing shipments were unchanged in April (+4.7% y/y) after a 0.2% m/m decline in March.
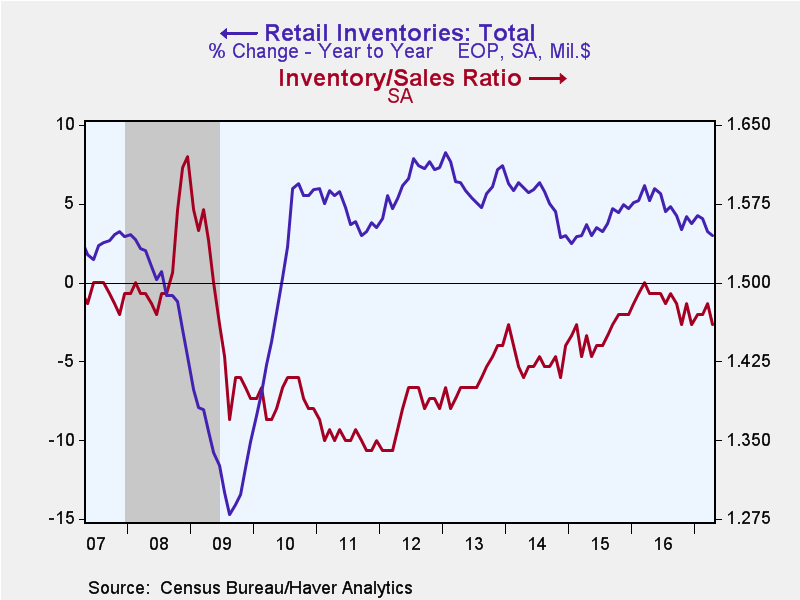
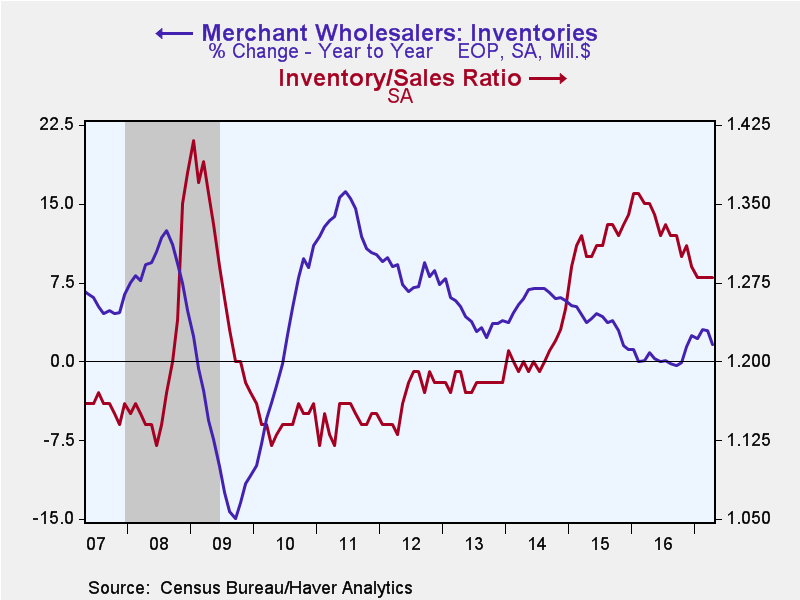
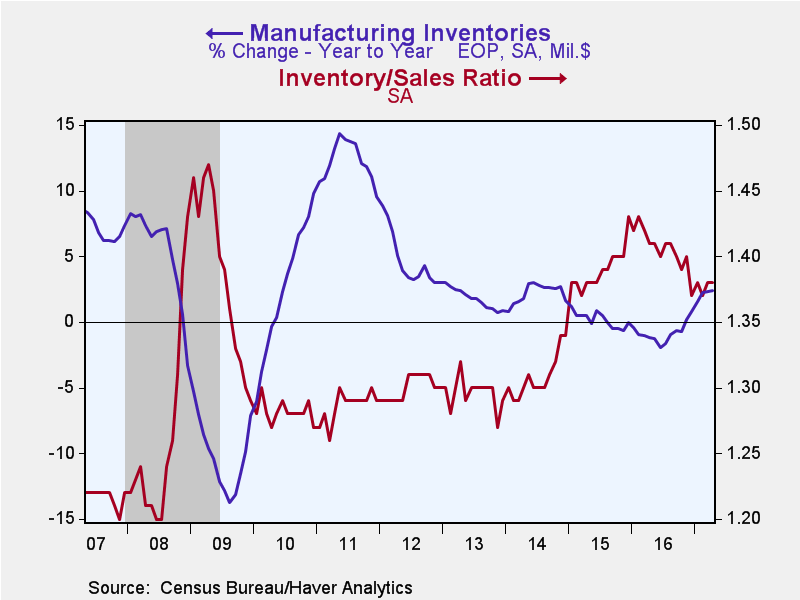
Total business inventories fell 0.2% y/y in April (+2.3% y/y) after five consecutive monthly increases. The March decline was slightly stronger than market expectations. Retail inventories also fell 0.2% m/m (+3.0% y/y) in April for their first decline in four months. The decline was widespread across sectors, led by a 0.6% m/m drop in clothing inventories and a 0.4% m/m decline in motor vehicle inventories. Food inventories jumped up 0.7% m/m. Retail inventories excluding motor vehicles also fell 0.2% m/m (+1.0% y/y) in April. Wholesale inventories plunged 0.5% m/m (+1.6% y/y) in April, while manufacturing inventories edged up 0.1% (2.4% y/y).
Even though sales have slowed over the past few months, they continue to grow faster than inventories, portending increases in production ahead. Over the past six months, sales have risen at a 5.4% annual rate while inventories have increase at a 3.7% annual pace over this period.
Faster growth in sales relative to inventories reduces the inventory-to-sales ratio. Indeed the total business I/S ratio has fallen consistently over the past year and the latest reading (1.37) is the lowest since May 2015. Though they have flattened some recently, wholesale and manufacturing I/S ratios have also fallen markedly since early 2016. The retail I/S ratio has exhibited less decline over this period but has nonetheless fallen meaningfully since early 2016.
This outpacing of sales relative to inventories depletes merchandise on sellers' shelves and eventually leads to new orders which then lead to increased production. This is a virtuous spiral that is occurring across the economy and augurs increased industrial activity in the near future.
The manufacturing and trade data are in Haver's USECON database.
| Manufacturing & Trade | Apr | Mar | Feb | Apr Y/Y | 2016 | 2015 | 2014 |
|---|---|---|---|---|---|---|---|
| Business Inventories (% chg) | -0.2 | 0.2 | 0.3 | 2.3 | 2.3 | 1.8 | 3.4 |
| Retail | -0.2 | 0.2 | 0.3 | 3.0 | 3.8 | 4.7 | 3.0 |
| Retail excl. Motor Vehicles | -0.2 | 0.1 | -0.1 | 1.0 | 1.8 | 3.8 | 2.6 |
| Merchant Wholesalers | -0.5 | 0.1 | 0.3 | 1.6 | 2.5 | 1.2 | 5.8 |
| Manufacturing | 0.1 | 0.2 | 0.2 | 2.4 | 0.8 | -0.1 | 1.6 |
| Business Sales (% chg) | |||||||
| Total | 0.0 | -0.1 | 0.3 | 5.6 | -0.1 | -3.2 | 2.8 |
| Retail | 0.5 | 0.1 | -0.2 | 4.8 | 2.7 | 1.9 | 4.0 |
| Retail excl. Motor Vehicles | 0.5 | 0.3 | 0.2 | 5.0 | 2.3 | 0.4 | 3.3 |
| Merchant Wholesalers | -0.4 | -0.2 | 0.7 | 7.3 | -0.5 | -4.9 | 3.6 |
| Manufacturing | 0.0 | -0.2 | 0.3 | 4.7 | -2.0 | -5.8 | 1.3 |
| I/S Ratio | |||||||
| Total | 1.37 | 1.37 | 1.37 | 1.42 | 1.40 | 1.38 | 1.31 |
| Retail | 1.46 | 1.48 | 1.47 | 1.49 | 1.48 | 1.45 | 1.43 |
| Retail excl. Motor Vehicles | 1.23 | 1.24 | 1.24 | 1.28 | 1.27 | 1.26 | 1.23 |
| Merchant Wholesalers | 1.28 | 1.28 | 1.28 | 1.35 | 1.33 | 1.32 | 1.21 |
| Manufacturing | 1.38 | 1.37 | 1.37 | 1.41 | 1.41 | 1.39 | 1.31 |
Sandy Batten
AuthorMore in Author Profile »Sandy Batten has more than 30 years of experience analyzing industrial economies and financial markets and a wide range of experience across the financial services sector, government, and academia. Before joining Haver Analytics, Sandy was a Vice President and Senior Economist at Citibank; Senior Credit Market Analyst at CDC Investment Management, Managing Director at Bear Stearns, and Executive Director at JPMorgan. In 2008, Sandy was named the most accurate US forecaster by the National Association for Business Economics. He is a member of the New York Forecasters Club, NABE, and the American Economic Association. Prior to his time in the financial services sector, Sandy was a Research Officer at the Federal Reserve Bank of St. Louis, Senior Staff Economist on the President’s Council of Economic Advisors, Deputy Assistant Secretary for Economic Policy at the US Treasury, and Economist at the International Monetary Fund. Sandy has taught economics at St. Louis University, Denison University, and Muskingun College. He has published numerous peer-reviewed articles in a wide range of academic publications. He has a B.A. in economics from the University of Richmond and a M.A. and Ph.D. in economics from The Ohio State University.


