 Global| Sep 20 2002
Crude Oil Prices Strong
by:Tom Moeller
|in:Economy in Brief
Summary
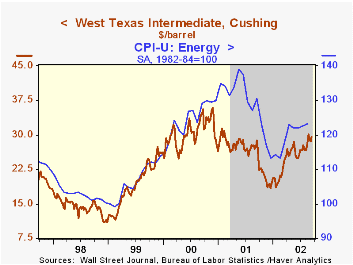
Oil prices recently have leveled off just below the $30.00 per barrel level for West Texas Intermediate crude, but strength in the energy market still is apparent in the more than 60% rise in prices since the end of last year. [...]

Oil prices recently have leveled off just below the $30.00 per barrel level for West Texas Intermediate crude, but strength in the energy market still is apparent in the more than 60% rise in prices since the end of last year.
Wholesale gasoline prices have risen a similar amount this year, and very recent gains have brought the year to date rise in fuel oil prices to near 60%.
Through August, the CPI for energy had risen 8.8% YTD. Piped gas and electricity costs as measured in the CPI were down year to date, but wholesale natural gas prices were up 65% from the weekly low in late 2001.
| Daily Crude Oil Prices | 9/13/02 | 8/9/02 | Y/Y | 2001 | 2000 | 1999 |
|---|---|---|---|---|---|---|
| West Texas Intermediate Crude Oil | $29.58 | $26.78 | 3.1% | $25.97 | $30.34 | $19.34 |
by Tom Moeller September 20, 2002

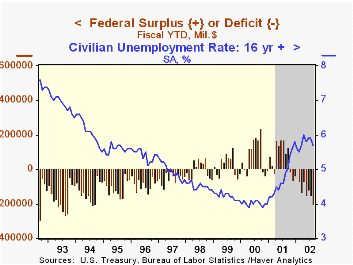
The August US budget deteriorated as expected. A monthly deficit of $55.0B had been expected versus last year's August deficit of $80.0B. Deficits are typical for August. Nevertheless, the August fiscal year-to-date deficit was the deepest since 1994.
Receipts fell m/m for the second straight month and continued on a pace toward a double-digit decline for the year. Individual tax payments fell 16.0% versus last fiscal YTD. Fiscal YTD corporate tax receipts fell 18.4%. Social Insurance taxes rose 0.9% fiscal YTD but the growth rate has slowed from a norm of 6-7% logged as recently as last fiscal year.
Federal expenditures rose sharply m/m, up 6.9% versus last fiscal YTD. Defense spending continued strong rising 13.8% versus last fiscal YTD. Transportation spending also rose a strong 18.8% and spending on education surged 20.7%. Spending on health programs rose 13.7% and income security was up 15.1%. Spending fell 15.9% for interest and fell 1.7% for Social Security.
| US Government Finance | Aug | July | Fiscal YTD | 2001 | 2000 | 1999 |
|---|---|---|---|---|---|---|
| Budget Balance | $-54.7B | $-29.2B | $-200.2B | $127.1B | $236.4B | $125.5B |
| Revenues | $124.6B | $134.4B | -9.4% | -1.7% | 10.8% | 6.1% |
| Outlays | $179.3B | $163.6B | 6.9% | 4.2% | 5.1% | 3.0% |
Tom Moeller
AuthorMore in Author Profile »Prior to joining Haver Analytics in 2000, Mr. Moeller worked as the Economist at Chancellor Capital Management from 1985 to 1999. There, he developed comprehensive economic forecasts and interpreted economic data for equity and fixed income portfolio managers. Also at Chancellor, Mr. Moeller worked as an equity analyst and was responsible for researching and rating companies in the economically sensitive automobile and housing industries for investment in Chancellor’s equity portfolio. Prior to joining Chancellor, Mr. Moeller was an Economist at Citibank from 1979 to 1984. He also analyzed pricing behavior in the metals industry for the Council on Wage and Price Stability in Washington, D.C. In 1999, Mr. Moeller received the award for most accurate forecast from the Forecasters' Club of New York. From 1990 to 1992 he was President of the New York Association for Business Economists. Mr. Moeller earned an M.B.A. in Finance from Fordham University, where he graduated in 1987. He holds a Bachelor of Arts in Economics from George Washington University.
More Economy in Brief
 Global| Feb 05 2026
Charts of the Week: Balanced Policy, Resilient Data and AI Narratives
by:Andrew Cates


