 Global| Aug 15 2019
Empire State Manufacturing Index Details Stronger than Headline in August
by:Sandy Batten
|in:Economy in Brief
Summary
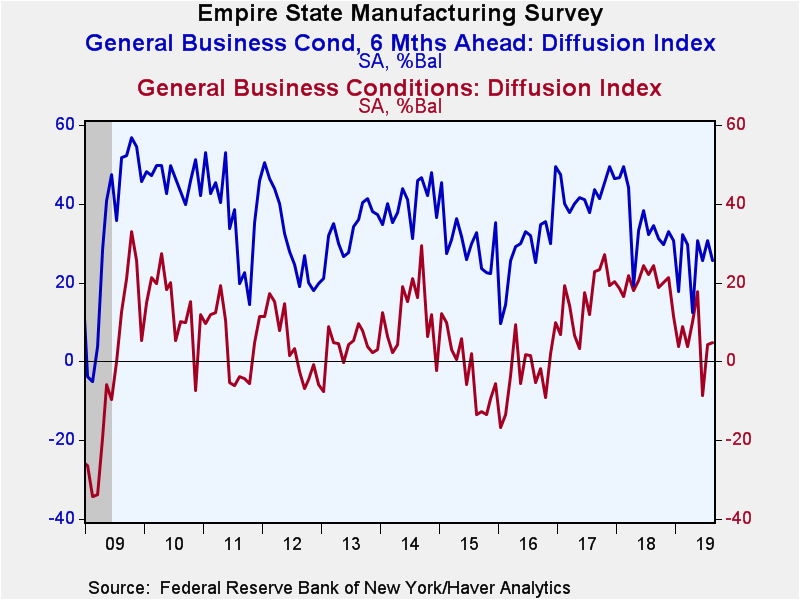
The Empire State Manufacturing Index of General Business Conditions rose to 4.8 in August from 4.3 in July. The Action Economics Forecast Survey expected the index to have slipped to 2.0. Twenty-seven percent of respondents reported [...]
The Empire State Manufacturing Index of General Business Conditions rose to 4.8 in August from 4.3 in July. The Action Economics Forecast Survey expected the index to have slipped to 2.0. Twenty-seven percent of respondents reported that conditions had improved from July to August while 22% reported that they had worsened. The Empire State data, reported by the Federal Reserve Bank of New York, reflect business conditions in New York, northern New Jersey and southern Connecticut.
In contrast to the headline ISM indexes, which are constructed from a subset of the components, the headline Empire State Index is a separate question about overall business conditions. Accordingly, Haver Analytics calculates a seasonally adjusted index that is comparable to the headline ISM index—that is, calculated from the same components as the headline ISM index. This calculated figure for August showed that the improvement in business conditions was more significant than indicated by the Empire State headline index. The ISM-adjusted index rose to 52.0 in August from 49.0 in July and 48.4 in June. A reading of 50 separates expansion from contraction. So, manufacturing activity in the FRBNY area moved from modest contraction to modest expansion in August. During the past 15 years, there has been a 77% simple correlation between the index level (which is a measure of change) and the quarter-to-quarter change in US real GDP.
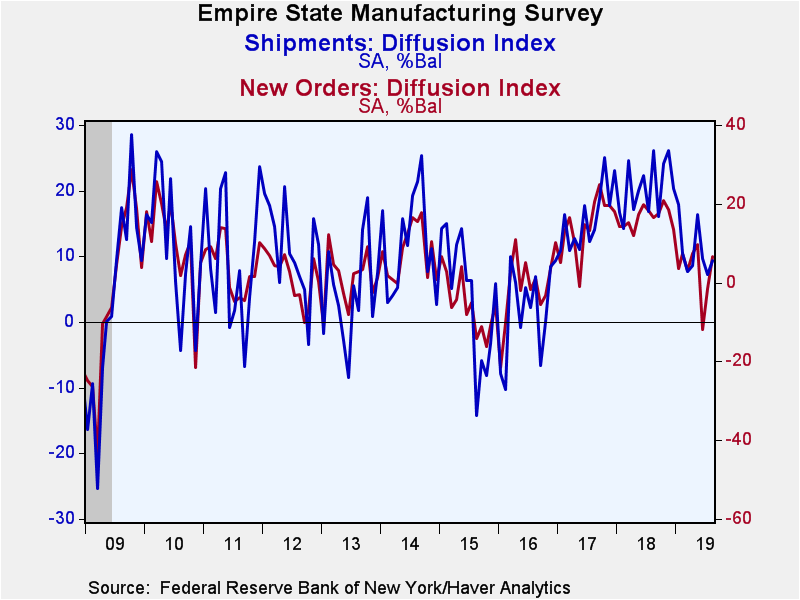
Among the sub-indexes, new orders climbed back above zero (the dividing line for expansion and contraction in the reported indexes) in August, rising to 6.7 after having fallen below zero in both June (-12.0) and July (-1.5). Shipments also moved up in August, to 9.3 from 7.2 in July. Unfilled orders declined for the third consecutive month. Delivery times were steady, and inventories increased for the first time since April.
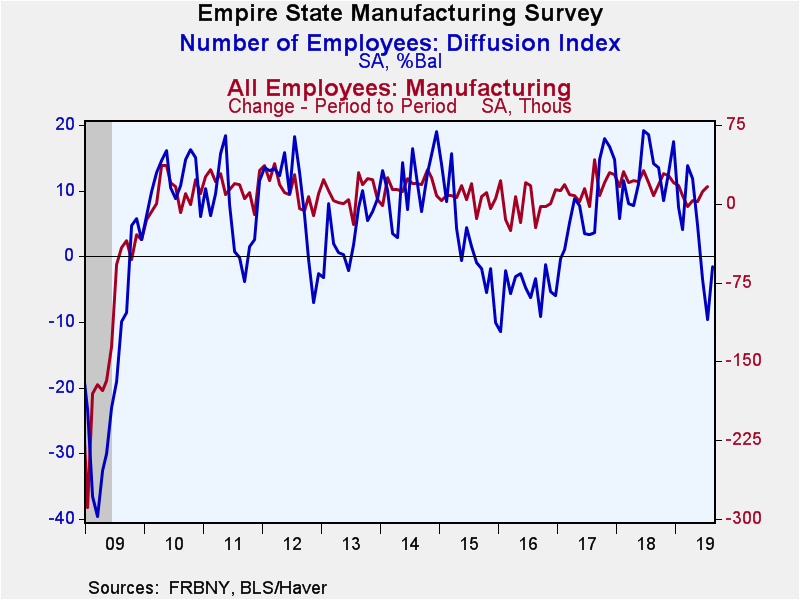
Employment conditions remained lackluster in August as the number of employees index remained below zero for the third consecutive month and the average workweek index slipped below zero. Nearly 14% of respondents reported increased hiring in August, up from 10% in July, but more than 15% reported a decline. Over the past 10 years, there has been a 38% correlation between the employment index and the month-to-month change in factory sector payrolls.
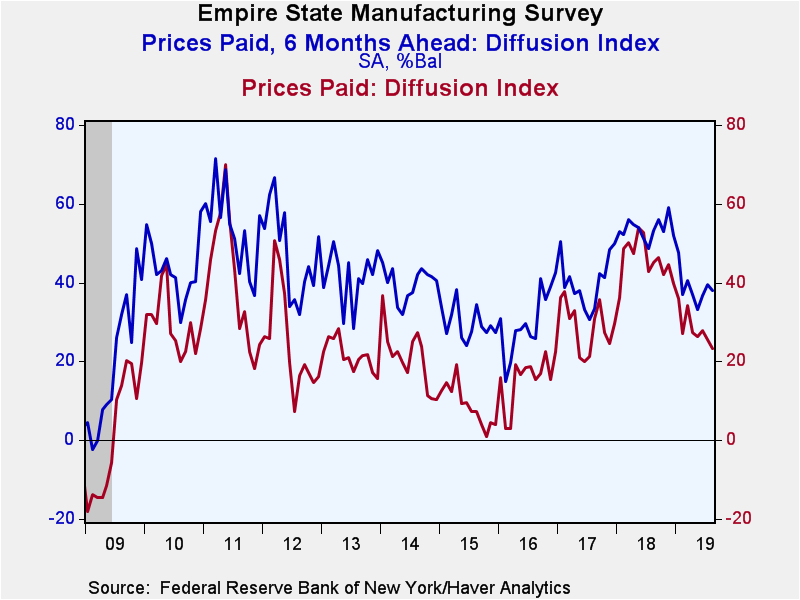
The prices paid index fell for the second consecutive month, to 23.2 in August from 25.5 in July and 27.8 in June, indicating a slower pace of increases in input prices. The prices received index fell for the sixth consecutive month, to 4.5, its lowest reading since May 2017 and an indication of continued muted inflation pressures.
The series measuring expectations for business conditions in six months slipped to 25.7 in August from 30.8 in July, indicating that firms were somewhat less optimistic about future conditions than they had been in July. Still the August reading remains well above the recent low of 12.4 reached in April.
The Empire State figures are diffusion indexes, which are calculated by subtracting the percentage of respondents reporting declines from the percentage reporting gains. The data are available in Haver's SURVEYS database. The ISM-adjusted headline index dates back to 2001. The Action Economics Forecasts can be found in Haver's AS1REPNA database.
| Empire State Manufacturing Survey | Aug | Jul | Jun | Aug'18 | 2018 | 2017 | 2016 |
|---|---|---|---|---|---|---|---|
| General Business Conditions (Diffusion Index, %, SA) | 4.8 | 4.3 | -8.6 | 24.3 | 19.8 | 16.1 | -2.6 |
| General Business Conditions Index (ISM Adjusted, >50=Increasing Activity, SA) | 52.0 | 49.0 | 48.4 | 56.7 | 56.4 | 54.6 | 48.1 |
| New Orders | 6.7 | -1.5 | -12.0 | 16.5 | 16.5 | 14.5 | -0.9 |
| Shipments | 9.3 | 7.2 | 9.7 | 26.1 | 20.4 | 15.9 | 1.9 |
| Unfilled Orders | -9.7 | -5.1 | -15.8 | 11.1 | 3.5 | 1.9 | -8.8 |
| Delivery Time | 0.0 | 4.4 | -4.5 | 10.4 | 9.1 | 6.1 | -4.8 |
| Inventories | 5.8 | -10.9 | -5.3 | 0.0 | 5.9 | 1.5 | -9.6 |
| Number of Employees | -1.6 | -9.6 | -3.5 | 14.1 | 12.4 | 8.1 | -5.1 |
| Average Employee Workweek | -1.3 | 3.8 | -2.2 | 8.0 | 7.8 | 4.6 | -5.1 |
| Prices Paid | 23.2 | 25.5 | 27.8 | 45.2 | 45.8 | 29.0 | 15.7 |
| Prices Received | 4.5 | 5.8 | 6.8 | 20.0 | 19.3 | 11.0 | 0.7 |
| Expectations 6 Months Ahead | 25.7 | 30.8 | 25.7 | 34.4 | 35.2 | 42.7 | 29.0 |
Sandy Batten
AuthorMore in Author Profile »Sandy Batten has more than 30 years of experience analyzing industrial economies and financial markets and a wide range of experience across the financial services sector, government, and academia. Before joining Haver Analytics, Sandy was a Vice President and Senior Economist at Citibank; Senior Credit Market Analyst at CDC Investment Management, Managing Director at Bear Stearns, and Executive Director at JPMorgan. In 2008, Sandy was named the most accurate US forecaster by the National Association for Business Economics. He is a member of the New York Forecasters Club, NABE, and the American Economic Association. Prior to his time in the financial services sector, Sandy was a Research Officer at the Federal Reserve Bank of St. Louis, Senior Staff Economist on the President’s Council of Economic Advisors, Deputy Assistant Secretary for Economic Policy at the US Treasury, and Economist at the International Monetary Fund. Sandy has taught economics at St. Louis University, Denison University, and Muskingun College. He has published numerous peer-reviewed articles in a wide range of academic publications. He has a B.A. in economics from the University of Richmond and a M.A. and Ph.D. in economics from The Ohio State University.


