 Global| May 15 2020
Empire State Manufacturing Index Rebounds in May But Still Depressed
by:Sandy Batten
|in:Economy in Brief
Summary
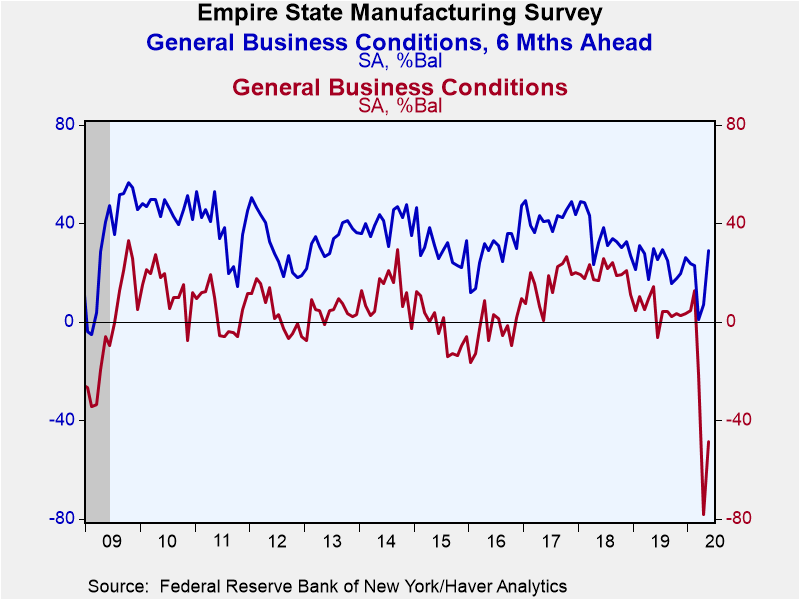
The Empire State Manufacturing Index of General Business Conditions rebounded to -48.5 in May from the record collapse to -78.2 in April. As bad as the May figure was, it was considerably above the Action Economics Forecast panel's [...]
The Empire State Manufacturing Index of General Business Conditions rebounded to -48.5 in May from the record collapse to -78.2 in April. As bad as the May figure was, it was considerably above the Action Economics Forecast panel's expectation of a -62.0 reading. The sample responses for today's report were collected between May 4 and May 10. The percentage of respondents reporting an increase in business conditions rose to 14.5% from 7.0% in April. The percentage reporting no change increased to 22.4% from 7.8% while the percentage reporting a further decline slipped to 63.1% from 85.2% in April. This is a diffusion index, which measures how widely dispersed a change is across an area. With nonessential businesses in the New York area having been closed in late March and are still closed, it is not surprising that a wide swath of respondents reported that conditions had weakened.
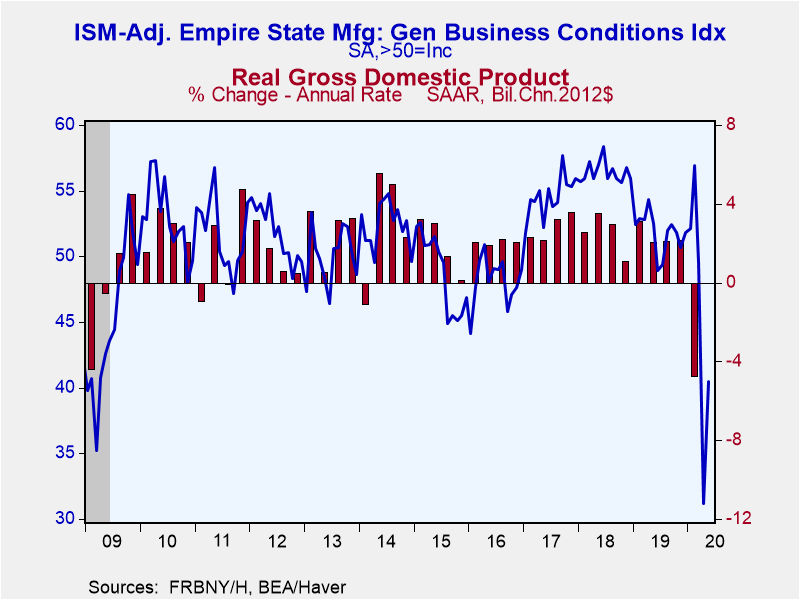
Haver Analytics calculates an ISM-Adjusted Index that mimics the construction of the purchasing managers' index. While this measure rose to 40.5 in May from a record low 31.2 in April, the May reading remains well the key 50 level which separates expansion from contraction.
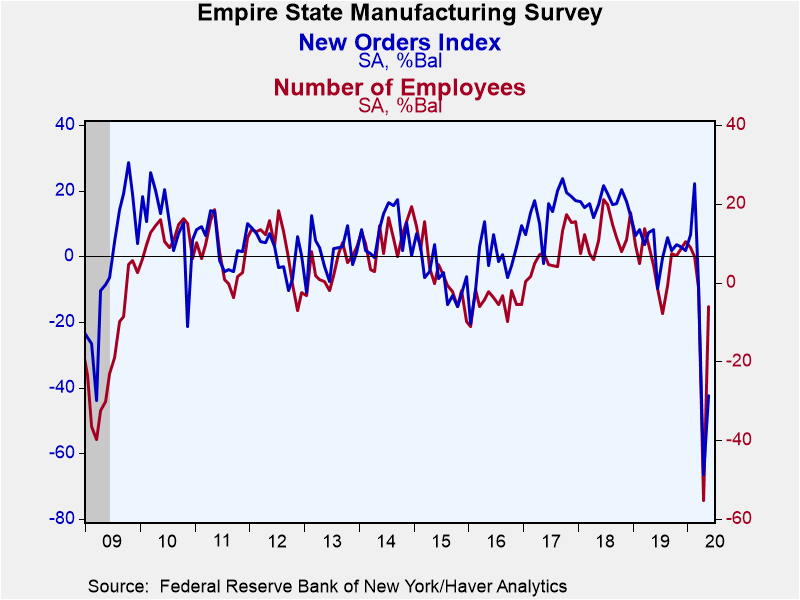
Not surprisingly, with the headline index remaining depressed in May, the subindexes did as well though they recovered some from their April depths. New orders rose to -42.4 from -66.3 and shipments increased to -39.0 from -68.1. The delivery index fell to -4.1 in May after having jumped up to 11.0 in April. The April increase would normally have indicated a growing economy in which demand is stretching supply. However, in the current environment, it likely indicates that supply chains have been severely disrupted by the business closures due to the spreading coronavirus. So, the May decline was actually some "better" news as it may have indicated that some supply-chain repair was underway.
Employment indicators improved relatively more in May than did the other subindexes though they remained below the critical 50 level. The number of employees subindex rebounded to -6.1 from -55.3 in April with the percentage reporting a further decline in employment falling to 20.8% from 58.6% in April. The average workweek rose to -21.6 in May from -61.6 in April with 34.4% of respondents reporting a further decline in May versus 64.7% reporting a decline in April.
The behavior of the Expected General Business Conditions index continued to indicate that on average the respondents thought the recent hit to business conditions would not linger very long. The expected conditions index rose to 29.1 in May from 7.0 in April and 1.2 in March. In contrast to the April report, the consensus was decidedly more positive in May. The percentage of respondents expecting better conditions in six months rose to 55.8% in May from 48.6% in April while the percentage expecting even weaker conditions in six months fell to 26.6% in May from 41.6% in April.
The Empire State figures are diffusion indexes, which are calculated by subtracting the percentage of respondents reporting declines from the percentage reporting gains. Their values range from -100 to +100. The data are available in Haver's SURVEYS database. The ISM-adjusted headline index dates back to 2001. The Action Economics Forecasts can be found in Haver's AS1REPNA database.
| Empire State Manufacturing Survey | May | Apr | Mar | May'19 | 2019 | 2018 | 2017 |
|---|---|---|---|---|---|---|---|
| General Business Conditions (Diffusion Index, %, SA) | -48.5 | -78.2 | -21.5 | 14.4 | 4.8 | 19.7 | 16.1 |
| General Business Conditions Index (ISM Adjusted, >50=Increasing Activity, SA) | 40.5 | 31.2 | 49.5 | 52.5 | 51.8 | 56.4 | 54.6 |
| New Orders | -42.4 | -66.3 | -9.3 | 8.2 | 3.3 | 16.4 | 14.4 |
| Shipments | -39.0 | -68.1 | -1.7 | 15.7 | 10.5 | 20.3 | 15.8 |
| Unfilled Orders | -20.3 | -16.8 | 1.4 | 2.1 | -6.0 | 3.5 | 1.9 |
| Delivery Time | -4.1 | 11.0 | 2.2 | 0.7 | -0.1 | 9.1 | 6.1 |
| Inventories | -3.4 | -9.7 | 5.8 | -4.1 | -0.9 | 5.9 | 1.5 |
| Number of Employees | -6.1 | -55.3 | -1.5 | 4.3 | 5.4 | 12.3 | 8.0 |
| Average Employee Workweek | -21.6 | -61.6 | -10.6 | 3.7 | 2.3 | 7.8 | 4.6 |
| Prices Paid | 4.1 | 5.8 | 24.5 | 26.2 | 26.3 | 45.8 | 29.0 |
| Prices Received | -7.4 | -8.4 | 10.1 | 12.4 | 10.3 | 19.3 | 11.0 |
| Expectations 6 Months Ahead | 29.1 | 7.0 | 1.2 | 29.7 | 23.9 | 35.2 | 42.6 |
Sandy Batten
AuthorMore in Author Profile »Sandy Batten has more than 30 years of experience analyzing industrial economies and financial markets and a wide range of experience across the financial services sector, government, and academia. Before joining Haver Analytics, Sandy was a Vice President and Senior Economist at Citibank; Senior Credit Market Analyst at CDC Investment Management, Managing Director at Bear Stearns, and Executive Director at JPMorgan. In 2008, Sandy was named the most accurate US forecaster by the National Association for Business Economics. He is a member of the New York Forecasters Club, NABE, and the American Economic Association. Prior to his time in the financial services sector, Sandy was a Research Officer at the Federal Reserve Bank of St. Louis, Senior Staff Economist on the President’s Council of Economic Advisors, Deputy Assistant Secretary for Economic Policy at the US Treasury, and Economist at the International Monetary Fund. Sandy has taught economics at St. Louis University, Denison University, and Muskingun College. He has published numerous peer-reviewed articles in a wide range of academic publications. He has a B.A. in economics from the University of Richmond and a M.A. and Ph.D. in economics from The Ohio State University.


