 Global| Aug 22 2005
Euro Zone Current Account Suffers from High Oil Prices and Chinese Competition
Summary
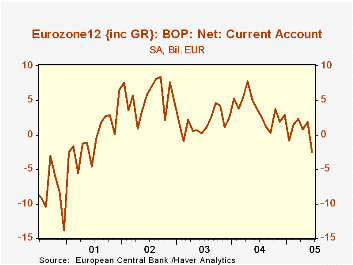
The current account in the Euro zone's balance of payments turned negative in June. Except for two other small monthly deficits, the current account, on a seasonally adjusted basis, for the area has been in surplus since 2002 as can [...]

The current account in the Euro zone's balance of payments turned negative in June. Except for two other small monthly deficits, the current account, on a seasonally adjusted basis, for the area has been in surplus since 2002 as can be seen in the first chart. The surplus on the current account has, however, been declining. The seasonally adjusted deficit for the month of June was 2.5 billion euros, compared with surplus in May of 1.9 billion euros and 3.8 billion euros in June, 2004. On a seasonally unadjusted basis the deterioration in the current account is starker. For the first half of this year, the non seasonally adjusted current account deficit was 14.5 billion euros, compared with a 19.5 billion euro surplus in the first half of 2004. With the decline in the current account, the financial account, representing the excess of capital outflows over inflows, has also declined.
Errors and omissions play a large role in the Euro zone's balance of payments. Over the past few years, this item has represented a capital outflow greater than the total of direct and indirect investment inflows. No doubt there are formidable problems of data collection regarding the investment flows of the twelve nations of the Euro zone that account for the large errors.
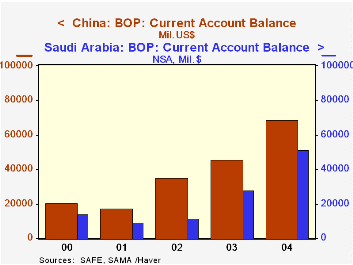
The growing deficit on current account in the Euro zone, to say nothing of the growing U.S. deficit, implies that other areas must be piling up growing surpluses. The two areas that come to mind as benefiting from current conditions are the Middle East and China. The rise in the oil price has obviously made substantial improvements in the current accounts of the middle eastern countries and some African and Latin American countries. Since monthly balance of payments data for many of these countries are not available, the second chart shows the 2000-2004 current account balances of Saudi Arabia, as representative of the oil producers, and the current account of China. Final results for the current year should show a further substantial rise in both accounts.
| Billions Euros | Jun 05 | May 05 | Jun 04 | M/M Dif | Y/Y Dif | 2004 | 2003 | 2002 |
|---|---|---|---|---|---|---|---|---|
| Current Account SA | -2.5 | 1.9 | 3.8 | -4.4 | -6.3 | 43.5 | 20.9 | 65.2 |
| Current Account NSA | -2.1 | -3.0 | 4.7 | 0.9 | -6.8 | 46.7 | 20.4 | 64.6 |
| Capital Account " | 1.9 | 1.7 | 0.9 | 0.2 | 1.0 | 17.3 | 13.3 | 10.2 |
| Financial Account " | 18.4 | 38.3 | 11.1 | -17.9 | 7.3 | -5.6 | -5.8 | -43.9 |
| Reserves " | 0.9 | 2.6 | -0.8 | -1.7 | 1.7 | 12.3 | 30.0 | -2.2 |
| Errors and Omissions " | -18.3 | -34.9 | -16.7 | 16.6 | -1.6 | -58.9 | -27.7 | -30.6 |
| Millions U.S. Dollars | 2004 | 2003 | 2002 | 2001 | 2000 | |||
| China Current Account | 68659 | 45857 | 35422 | 17401 | 20218 | |||
| Saudi Arabia Current Ac | 51488 | 28048 | 11873 | 9353 | 14317 |


