 Global| May 08 2006
European Commission Raises Forecast for EU and Euro Zone
Summary
TheDirectorate-General for Economic and Financial Affairs of the European Commission released its Spring 2006 Economic Forecasts. The complete document can be found here. Forecasts for 2006 and 2007 are given for the twenty-five [...]

TheDirectorate-General for Economic and Financial Affairs of the European Commission released its Spring 2006 Economic Forecasts. The complete document can be found here.
Forecasts for 2006 and 2007 are given for the twenty-five countries of the European Union, the candidate countries--Bulgaria, Romania, and Turkey--and Croatia, the former Yugoslav Republic of Macedonia, the U. S. Japan and China.
The Commission is forecasting growth in 2006 of 2.3% for the European Union, 0.2% higher than forecast six months ago. For the Euro Zone the forecast is 2.1%. For 2007 GDP growth for the European Union is forecast at 2.2%. The decline is due largely to forecasts for the Euro Zone, particularly Germany, where the increase in the Value Added Tax (VAT) rate by 3 percentage points on January 1, 2007 is expected to dampen consumption.
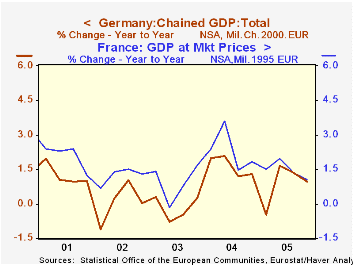
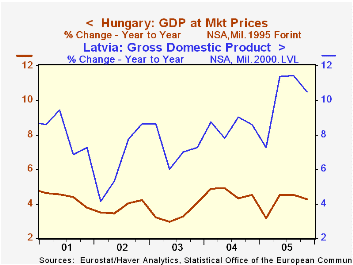
Data on the past growth trends among the various countries of the European Union, comparable to the forecast data, can be found in the Haver Data Base--EUROSTAT. (For the non European countries, see their individual data bases.) Trends in economic growth among the EU countries have varied widely over the past four years. The Euro Zone countries have generally shown sub par performance while those in Central and Eastern Europe and in the Baltics have shown considerable dynamism. The first chart shows the year-to-year percentage changes in the Gross Domestic Product for France and Germany while the second chart shows comparable data for Latvia and Hungary.
| GDP Rate of Change (%) | 2002 | 2003 | 2004 | 2005 | 2006F | 2007F |
|---|---|---|---|---|---|---|
| European Union | 1.2 | 1.2 | 2.4 | 1.6 | 2.3 | 2.2 |
| Euro Zone | 0.9 | 0.7 | 2.0 | 1.3 | 2.1 | 1.8 |
| France | 1.2 | 0.8 | 2.3 | 1.4 | 1.9 | 2.0 |
| Germany | 0.1 | -0.2 | 1.6 | 0.9 | 1.7 | 1.0 |
| Latvia | 6.5 | 7.2 | 8.5 | 10.2 | 7.5 | 7.6 |
| Hungary | 3.8 | 3.4 | 4.6 | 4.1 | 4.6 | 4.2 |
More Economy in Brief
 Global| Feb 05 2026
Charts of the Week: Balanced Policy, Resilient Data and AI Narratives
by:Andrew Cates


