 Global| Nov 16 2007
Foreign Investors Renew Commitment to US Markets, Albeit Limited, According to New TIC Data
Summary
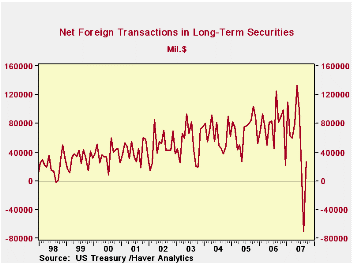
After their exodus from US financial markets in August, foreign investors returned in September with moderate net purchases of US long-term securities. These totaled $26.4 billion, compared with August's $70.6 billion liquidation [...]

After their exodus from US financial markets in August, foreign investors returned in September with moderate net purchases of US long-term securities. These totaled $26.4 billion, compared with August's $70.6 billion liquidation (revised from the original $85.5 billion reported).
Even as foreign investors returned, they did so in a much more
limited way than earlier this year, and with a more conservative asset
mix. Net purchases of domestic securities were $55.4 billion, almost
half of which, $26.3 billion, were Treasuries. Both private and
official foreign institutions were net buyers both of Treasuries and in
total. Back in August, private foreigners had been net purchasers of
Treasuries as well, but official institutions were net sellers then.
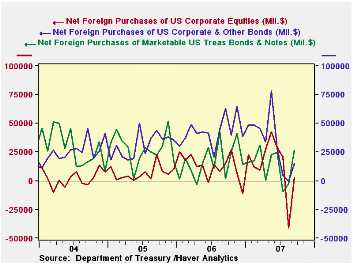
There were net purchases of all three of the other securities
categories, $11.5 billion in Agencies, $15.1 billion in corporate bonds
and $2.5 billion in equities. The resumption of corporate bond
purchases is impressive after August's small net sales, although the
amount is modest compared with a $43 billion monthly average during
2006 and $47 billion in the first half of this year. Regarding
equities, it looks that the most we can say, with just $2.5 billion in
purchases, is that the net selling stopped. The figures here don't show
much conviction about increasing US equity positions. So foreign
investors highlighted Treasury securities in their September
acquisitions, but were restrained toward other, riskier securities.
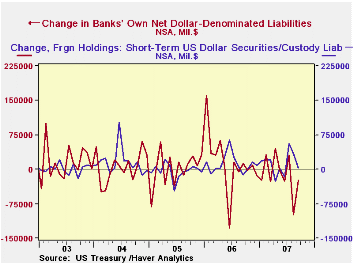
Last month here, we emphasized the erratic nature of other types of foreigners' participation in the US financial system. They can buy short-term securities, including Treasury bills, or other paper, and they had done so in size in July and August, $56.2 billion and $33.9 billion, respectively. In September, however, this practice was far less extensive, as only $3.8 billion went into these assets. By then, rates on T-bills were quite low and the market for commercial paper was shrinking rapidly, making those both less attractive outlets. And as we pointed out in our summary of August data, these items are by definition transitory holdings anyway. Also, bank deposits from foreign account holders and other bank liabilities to foreigners had decreased sharply in August, and these actually continued to do so in September. Possibly the unpopular dollar is a main factor here, as traders reduce their cash in US banks when they sell dollars. Again, though, substantive explanations are hard to come by for these assets, since they too are largely short-term holdings.
So it is encouraging to see a return to net inflows to US markets from foreign investors, but the September performance still shows significant hesitation. As we also mentioned last month, this is no different from the attitudes of US investors, is it?
| Net Foreign Purchases from US Residents, Bil $ | Sept 2007 | August 2007 | July 2007 | June 2007 | Monthly Averages | ||
|---|---|---|---|---|---|---|---|
| Last 12 Months | 2006 | 2005 | |||||
| "Headline": Net
Foreign Purchases = 1 + 2 + Other* |
26.4 | -70.6 | 19.5 | 99.9 | 60.8 | 76.2 | 69.9 |
| 1. Domestic Securities | 55.4 | -36.1 | 25.0 | 121.7 | 87.8 | 97.2 | 84.3 |
| Treasuries | 26.3 | -2.8 | -9.4 | 24.7 | 17.3 | 17.3 | 28.2 |
| Agencies | 11.5 | 8.4 | 8.7 | 39.6 | 21.0 | 24.5 | 18.3 |
| Corporate Bonds | 15.1 | -0.9 | 4.5 | 28.5 | 41.0 | 42.8 | 31.0 |
| Equities | 2.5 | -40.6 | 21.2 | 28.8 | 13.4 | 12.6 | 6.8 |
| 2. Foreign Securities | -29.0 | -34.5 | -5.5 | -21.8 | -27.0 | -21.0 | -14.4 |
| 3. Short-Term Sec's & Custody Holdings | 3.8 | 33.9 | 56.2 | -16.0 | 11.7 | 12.2 | -4.0 |
| 4. Banks' Liabilities | -24.3 | -97.8 | 30.3 | -15.4 | -8.5 | 15.3 | 1.4 |
| Total TIC Flows** | -14.7 | -150.7 | 83.5 | 43.6 | 47.4 | 89.5 | 55.4 |
| China | 8.5 | -10.1 | 4.5 | 21.2 | 10.0 | 9.7 | 7.4 |
| United Kingdom | -4.4 | 31.7 | 25.1 | 55.4 | 35.7 | 26.5 | 26.4 |
| Cayman Islands | 14.8 | -14.7 | -16.4 | 9.6 | 7.3 | 12.1 | 4.1 |
| *"Other" includes stock swaps and repayments of capital on asset-backed securities. | |||||||
| **Sum of Lines 1. through 4 (plus "other" noted above. Line 1 is the sum of the security types listed immediately below it.) | |||||||
Carol Stone, CBE
AuthorMore in Author Profile »Carol Stone, CBE came to Haver Analytics in 2003 following more than 35 years as a financial market economist at major Wall Street financial institutions, most especially Merrill Lynch and Nomura Securities. She has broad experience in analysis and forecasting of flow-of-funds accounts, the federal budget and Federal Reserve operations. At Nomura Securites, among other duties, she developed various indicator forecasting tools and edited a daily global publication produced in London and New York for readers in Tokyo. At Haver Analytics, Carol is a member of the Research Department, aiding database managers with research and documentation efforts, as well as posting commentary on select economic reports. In addition, she conducts Ways-of-the-World, a blog on economic issues for an Episcopal-Church-affiliated website, The Geranium Farm. During her career, Carol served as an officer of the Money Marketeers and the Downtown Economists Club. She has a PhD from NYU's Stern School of Business. She lives in Brooklyn, New York, and has a weekend home on Long Island.


