 Global| Apr 25 2006
German and Dutch Business Confidence Continues to Rise: Dutch Consumers Less Negative
Summary
Following on yesterday's reports on business confidence from France and Belgium, two more reports were released today from Germany and the Netherlands. In Germany, the IFO institute's index rose to 105.9 in April from 105.4 in March. [...]

Following on yesterday's reports on business confidence from France and Belgium, two more reports were released today from Germany and the Netherlands. In Germany, the IFO institute's index rose to 105.9 in April from 105.4 in March. This was the highest level since April, 1991. In terms of the diffusion index, which shows the percent balance of opinion of the respondents, the excess of optimists over pessimists was 11.0%, up from 10.0% in March. Both measures have been rising for the past four months. The consensus had predicted a slight decline for April. Business confidence has also risen in the Netherlands over the past four months and now the excess of optimists over pessimists is 6.1%, the highest since November 2000. The percent balances for Germany and the Netherlands are shown in the first chart.
In spite of the show of confidence in the current situation, business is beginning to show a little caution regarding the outlook. In Germany the percentage of respondents who expect better conditions six months ahead over those who expect worse condition fell from 13.9% to 13.4%. In the Netherlands the percentage of respondents who expect increased production over the next six months over those who expect lower production fell from 22% to 17% in April. The latter figure is not seasonally adjusted whereas the German figure is.
In addition to the overall measure of the business climate, the IFO also provides measures of the business climate for its component industries--manufacturing, construction, wholesale and retail trade. Also available at a later date are data for the components of the manufacturing industry and a wealth of other detail. Current conditions in manufacturing, construction and wholesale trade all improved in April but the conditions in the retail trade sector deteriorated slightly after a sharp improvement earlier in the year.
Available since May, 2001, are the results of the IFO's survey of about 2000 firms in the business-oriented segments of the tertiary sector (excluding distribution, financial services, leasing, insurance and government.) This indicator is not yet seasonally adjusted and has not yet been incorporated into the IFO Business Climate Index for industry and trade. In general those engaged in the service sector have had a more positive appraisal of the business climate than those engaged in industry and trade as can be seen in the second chart which compares the diffusion index for the service sector with that for industry and trade.
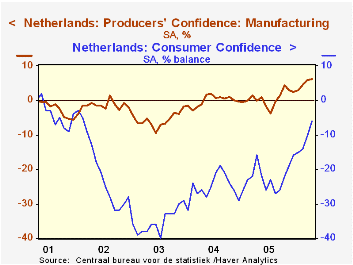
After September 11, 2001 consumer confidence in the Netherlands fell much more sharply than business confidence and it has yet to reach a point where the optimists outweigh the pessimists, however, the excess of pessimists is diminishing. The third chart compares consumer and business confidence in the Netherlands.
| Confidence Measures Percent Balances |
Apr 06 | Mar 06 | Apr 05 | M/M Dif | Y/Y Dif | 2005 | 2004 | 2003 |
|---|---|---|---|---|---|---|---|---|
| Germany: IFO Business Climate Total |
11.0 | 10.0 | -14.8 | 1.0 | 25.8 | -9.8 | -9.9 | -17.2 |
| Manufacturing | 20.7 | 19.2 | -4.9 | 1.5 | 25.6 | 1.1 | 4.4 | -7.9 |
| Construction | -13.9 | -17.6 | -37.8 | 3.7 | 23.9 | -37.2 | -42.2 | -43.3 |
| Wholesale Trade | 10.7 | 9.6 | -17.4 | 1.1 | 28.1 | -9.9 | -16.6 | -25.3 |
| Retail Trade | -5.3 | -1.8 | -31.1 | -3.5 | 25.8 | -28.0 | -30.8 | -22.6 |
| Service (Not Included in Total) | 23.5 | 21.0 | 5.5 | 2.5 | 18.0 | 8.1 | 6.5 | -0.4 |
| Expectations Total | 13.4 | 13.9 | -10.2 | -0.5 | 23.6 | -5.2 | -2.1 | -6.6 |
| The Netherlands | ||||||||
| Producers' Confidence | 6.1 | 5.8 | -0.1 | 0.2 | 6.2 | 0.6 | -0.1 | -5.6 |
| Expected Production | 17 | 22 | 10 | -5 | 7 | 6 | 4 | 1 |
| Consumer Confidence | -6 | -10 | -16 | 4 | 10 | -22 | -25 | -35 |
| Climate | 6 | -1 | -10 | 7 | 16 | -23 | -32 | -56 |
| Willingness to buy | -14 | -15 | -20 | 1 | 6 | -22 | -21 | -21 |


