 Global| Sep 05 2007
How Much Have Home Values Changed? -- Well, It Depends . . . .
Summary
In this time when homes and their values are playing a key role in financial market developments, it's important to examine the behavior of various house price indexes and to know what they are measuring. Last evening, the Federal [...]

In this time when homes and their values are playing a key role in financial market developments, it's important to examine the behavior of various house price indexes and to know what they are measuring. Last evening, the Federal Home Loan Mortgage Corporation (Freddie Mac or FHLMC) reported its quarterly index, Conventional Mortgage Home Price Index, for Q2, and last week, data were published by the Office of Federal Housing Enterprise Oversight (OFHEO), the National Association of Realtors (NAR) and S&P/Case-Shiller. So a comparison is timely, too, with the freshness of the data. All of the measures shown here cover existing houses.
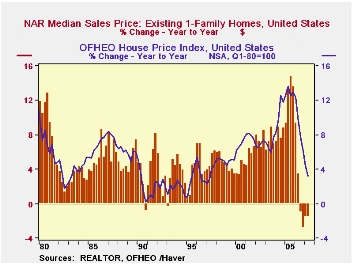
The easiest price measure to understand is the NAR median price for existing homes. The National Association of Realtors surveys real estate boards around the country each month for their sales reports. The price measure is the median of all those reported within each of the four Census regions of the country. The regions are combined in a national index, with each region weighted according to the number of housing units located there at the time of the 2000 decennial Census. Thus, in any given period, the price measure is not affected by the distribution of current sales. It does not matter whether sales or price changes were concentrated in an expensive region or a more moderately priced one. At the same time, the price is simply the median of the houses whose sales closed that month, regardless of size or other characteristics. So this composite price measure involves quality differences in homes as well as pure price change. Through Q2, it was down 1.6% from a year ago, having flattened after its run-up into mid-2005. [The July figure, not relevant for our present discussion, was down 1.0% from July 2006.]
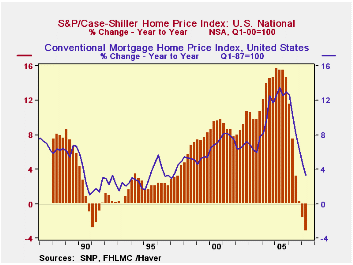
The issue of quality differentials is a significant problem, but not one the Realtors operations are designed to handle. The other indexes covered here do that through the method of "repeat sales". An existing house that sells in a specific quarter would have been sold at least one other time, so its current price can be compared to its own previous price. To accomplish this comparison, the compilers need access to a database that includes such detailed price records. For the S&P/Case-Shiller Index, they use county registrars' mortgage and deed transfer records. This provides a universe, not just a sample of sales transactions. The huge volume of these data mean, though, that the index cannot practically be computed for every county in the country. So it covers 20 MSAs on a monthly basis with broader coverage for each quarter's national total. In Q2, this index was down 3.2% from its year-ago value; the latest monthly figures cover June, which was down 3.5% from June 2006. So additional time is required to produce this index, compared with the simple current- period averaging process of the NAR measure. The Case-Shiller index also uses value weights to combine local areas into the national total; thus, the more expensive regions carry more weight, possibly making this more useful to portfolio managers who want to judge the performance of a real estate portfolio.
The S&P/Case-Shiller data begin in 1987. A series compiled and published by the Federal Home Loan Mortgage Corporation includes history back to 1970. Also a repeat-transaction series, it uses mortgage data for loans owned by FHLMC and the Federal National Mortgage Association (FNMA), so it is called the "Conventional Mortgage House Price Index". In Q2, released just late on September 4, it was UP 3.3% from a year earlier. This is the weakest outcome in since early 1997, although it is not the weakest showing ever. These prices, which have never declined outright on a yearly basis, were up only 1.0% in Q4-1990 and 1.2-1.3% during the protracted 1982/83 recession. The federal government regulator of FHLMC and FNMA is the Office for Federal Housing Enterprise Oversight, OFHEO. This organization produces a similar series that goes back to 1975; it was up 3.2% in Q2, with a comparable historical performance to Freddie Mac's data. These series are available for states and a broad collections of MSAs. The national aggregate is computed, similar to the NAR series, using as weights the number of housing units in the various regions. Since they are based on loans owned by FNMA and FHLMC, they cover transactions that conform to the limits set on FNMA's and FHLMC's business; in particular, the highest priced home whose mortgage they can own is $417,000. Thus, more expensive homes are not included in these series.
The national aggregates of all these home price series are contained in Haver's USECON database. The state and local measures are in the REGIONAL database.
| Existing Single Family House Prices | Q2 2007 | Q1 2007 | Q4 2006 | Year Ago | 2006 | 2005 | 2004 |
|---|---|---|---|---|---|---|---|
| NAR Median | $223,467 | $212,633 | $219,033 | $227,067 | $221,883 | $217,492 | $192,808 |
| Y/Y % Change | -1.6 | -1.6 | -2.8 | +3.5 | +2.0 | +12.8 | +8.1 |
| S&P/Case-Shiller 2000Q1 = 100 |
183.9 | 185.6 | 187.4 | 189.9 | 188.7 | 179.0 | 155.2 |
| Y/Y % Change | -3.2 | -1.6 | +0.2 | +7.5 | +5.4 | +15.3 | +13.8 |
| OFHEO, 1980Q1 = 100 | 409.4 | 409.1 | 406.8 | 396.8 | 399.1 | 366.3 | 324.3 |
| Y/Y % Change | 3.2 | 4.4 | 6.1 | 10.0 | 9.0 | 13.0 | 10.6 |
| Conv Mrtg Home Price Index, 1987Q1 = 100 | 297.4 | 297.1 | 295.6 | 287.9 | 289.7 | 265.3 | 235.0 |
| Y/Y % Change | 3.3 | 4.6 | 6.4 | 10.2 | 9.2 | 12.9 | 10.6 |
Carol Stone, CBE
AuthorMore in Author Profile »Carol Stone, CBE came to Haver Analytics in 2003 following more than 35 years as a financial market economist at major Wall Street financial institutions, most especially Merrill Lynch and Nomura Securities. She had broad experience in analysis and forecasting of flow-of-funds accounts, the federal budget and Federal Reserve operations. At Nomura Securities, among other duties, she developed various indicator forecasting tools and edited a daily global publication produced in London and New York for readers in Tokyo. At Haver Analytics, Carol was a member of the Research Department, aiding database managers with research and documentation efforts, as well as posting commentary on select economic reports. In addition, she conducted Ways-of-the-World, a blog on economic issues for an Episcopal-Church-affiliated website, The Geranium Farm. During her career, Carol served as an officer of the Money Marketeers and the Downtown Economists Club. She had a PhD from NYU's Stern School of Business. She lived in Brooklyn, New York, and had a weekend home on Long Island.
More Economy in Brief
 Global| Feb 05 2026
Charts of the Week: Balanced Policy, Resilient Data and AI Narratives
by:Andrew Cates


