 Global| Nov 07 2011
Indonesia: Capital Inflows
Summary
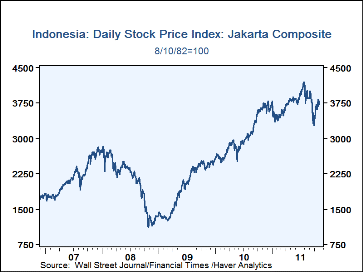
Indonesia has become a favorite of the international investment community. The stock market, Jakarta Composite (Aug. 1982=100) is currently at 3,778.28, more than three times its value on October 28, 2008, 1,111.39, its the low point [...]
Indonesia has become a favorite of the international investment community. The stock market, Jakarta Composite (Aug. 1982=100) is currently at 3,778.28, more than three times its value on October 28, 2008, 1,111.39, its the low point in the 2008 world financial crisis. Its almost steady rise since then was intercepted by the current financial crisis in the Euro Area. The market declined from a peak of 4,193.46 on August 3 of this year to a low of 3,269.45 on October 4th, but it has since recovered and closed today at 3,778.24 pacific time. The first chart shows the daily price of the Jakarta Composite Stock Price Index over the past five years.
Foreign interest in the economy of Indonesia has resulted in sharply rising inflows of portfolio and direct investment. The sum of net direct and portfolio investment in Indonesia and risen from $3,751 million in the fourth quarter of 2008 to $8,442 million in the second quarter of 2011. Direct investment tends to be less volatile than portfolio investment. At the peak of the 2008 financial crisis in the fourth quarter, direct investment continued to flow into Indonesia, although at a reduced rate, but portfolio investment experienced a big outflow. Foreigners withdrew $4,004 million from the Indonesian stock and bond markets and Indonesians withdrew $467 million from foreign markets.
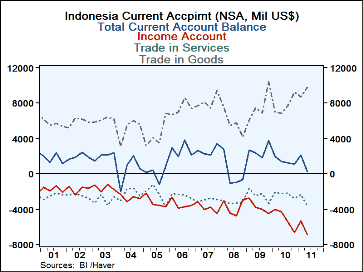
As a result of the increased foreign investment, income payments in the current account of the balance of payments have begun to rise as dividend and interest on portfolio investments and profits on direct investment have increased. The second chart show the trade, service and income components of the current account. The trade account, which has generally been positive, has been the principal component of the current account but the income component, which is generally negative, is beginning to rise in importance as can be seen in the second chart.
| Millions of US$ | Q2-11 | Q1-11 | Q4-10 | Q3-10 | Q2-10 | Q1-10 | Q4-08 |
|---|---|---|---|---|---|---|---|
| Direct Investment | 2700 | 3041 | 4241 | 1684 | 2298 | 2484 | 720 |
| In Indonesia | 5247 | 4789 | 4305 | 2875 | 3280 | 2911 | 1937 |
| Abroad | -2547 | -1748 | -66 | -1191 | -989 | -427 | -1217 |
| Portfolio Investment | 5742 | 3798 | 1436 | 4517 | 1089 | 6160 | -4471 |
| In Indonesia | 6278 | 4109 | 1789 | 6110 | 1241 | 6569 | -4004 |
| Abroad | -536 | -311 | -353 | -1597 | -152 | -409 | -467 |
| Direct + Portfolio | 8442 | 6839 | 5677 | 6201 | 3387 | 8644 | -3571 |
More Economy in Brief
 Global| Feb 05 2026
Charts of the Week: Balanced Policy, Resilient Data and AI Narratives
by:Andrew Cates


