 Global| May 16 2006
Industrial Production Jumped
by:Tom Moeller
|in:Economy in Brief
Summary
Total industrial output jumped 0.8% last month following two months of 0.5% gain. Consensus expectations had been for another 0.5% increase. Factory sector output surged 0.8% (5.5% y/y) after an unrevised 0.5% March increase. That [...]
Total industrial output jumped 0.8% last month following two months of 0.5% gain. Consensus expectations had been for another 0.5% increase.
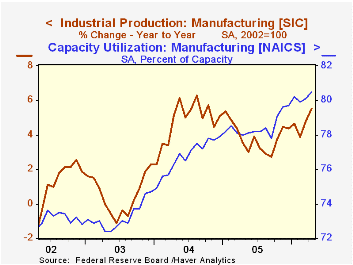
Factory sector output surged 0.8% (5.5% y/y) after an unrevised 0.5% March increase. That increase matched a 0.8% January spike and lifted the y/y gain in factory output to its highest since in over a year.
A 1.7% (12.4% y/y) rise in business equipment output provided umph to last month's gain in output as output of computers, communication equipment and semiconductors jumped 2.4% (21.7% y/y). Factory output excluding high tech, however, also was strong and rose 0.7% (4.6% y/y).
Output of nondurable consumer goods rose 0.4% (2.1% y/y) as appliance & furniture output rose 0.2% (4.0% y/y). Automotive products' production fell 1.1% (+4.2% y/y). Excluding motor vehicles and high tech factory output increased 0.9% (4.7% y/y).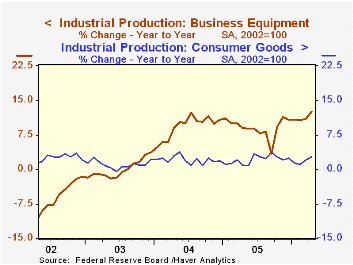
Output of primary metals jumped 1.2% (6.7% y/y) following two months of decline and fabricated metals output rose 0.5% (6.1% y/y).
Total capacity utilization surged to 81.9%, the highest level since July of 2000. Factory sector utilization rose to 80.5%, also its highest level since 2000. During the last twenty years there has been a 36% correlation between the level of factory sector utilization and the y/y change in "core" producer prices. There also has been a 37% correlation with the change in core consumer prices.
Industrial capacity grew 0.1% (1.9% y/y) and the annual rate of growth is up from 1.3% last year and 0.3% during 2004. Factor sector capacity grew 0.2% (2.3% y/y) compared to 1.6% growth last year and 0.2% growth during 2004. Much of that growth has been in the high tech sector. Excluding high tech, factory sector capacity is up 1.0% y/y.
The 1990s Acceleration in Labor Productivity: Causes and Measurement from the Federal Reserve Bank of St. Louis can be found here.
| Production & Capacity | April | Mar | Y/Y | 2005 | 2004 | 2003 |
|---|---|---|---|---|---|---|
| Total Industrial Production | 0.8% | 0.6% | 4.8% | 3.2% | 4.1% | 0.6% |
| Manufacturing | 0.8% | 0.5% | 5.5% | 3.9% | 4.8% | 0.5% |
| Consumer Goods | 0.2% | 0.8% | 2.7% | 2.1% | 2.1% | 1.0% |
| Business Equipment | 1.7% | 0.7% | 12.4% | 9.1% | 9.3% | 0.0% |
| Capacity Utilization | 81.9% | 81.4% | 79.7% (4/05) | 80.1% | 78.6% | 75.7% |

Tom Moeller
AuthorMore in Author Profile »Prior to joining Haver Analytics in 2000, Mr. Moeller worked as the Economist at Chancellor Capital Management from 1985 to 1999. There, he developed comprehensive economic forecasts and interpreted economic data for equity and fixed income portfolio managers. Also at Chancellor, Mr. Moeller worked as an equity analyst and was responsible for researching and rating companies in the economically sensitive automobile and housing industries for investment in Chancellor’s equity portfolio. Prior to joining Chancellor, Mr. Moeller was an Economist at Citibank from 1979 to 1984. He also analyzed pricing behavior in the metals industry for the Council on Wage and Price Stability in Washington, D.C. In 1999, Mr. Moeller received the award for most accurate forecast from the Forecasters' Club of New York. From 1990 to 1992 he was President of the New York Association for Business Economists. Mr. Moeller earned an M.B.A. in Finance from Fordham University, where he graduated in 1987. He holds a Bachelor of Arts in Economics from George Washington University.
More Economy in Brief

 Global| Feb 05 2026
Charts of the Week: Balanced Policy, Resilient Data and AI Narratives
by:Andrew Cates

