 Global| Jul 06 2004
ISM Non-Manufacturing Index Down, Employment At Record High
by:Tom Moeller
|in:Economy in Brief
Summary
The Business Activity Index for the Non-manufacturing Sector, reported by the Institute for Supply Management, fell last month to 59.9 from 65.2 in May. Consensus expectations had been for little change at 64.0. Since the series' [...]
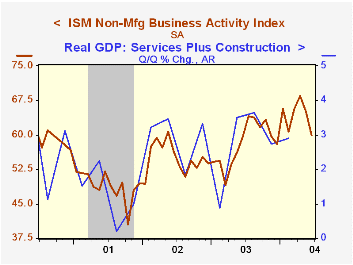
The Business Activity Index for the Non-manufacturing Sector, reported by the Institute for Supply Management, fell last month to 59.9 from 65.2 in May. Consensus expectations had been for little change at 64.0.
Since the series' inception in 1997 there has been a 60% correlation between the Business Activity Index and the q/q change in GDP services plus construction.
The employment index added to prior gains and rose to 57.4, a record high. Higher employment was reported by 27% of firms versus 17% last year and 12% in 2002.
Since the series' inception in 1997 there has been a 60% correlation between the level of the ISM non-manufacturing employment index and the m/m change in payroll employment in the service producing and construction industries.
The new orders index rose to 62.4 from 61.3 in May.Business activity for the non-manufacturing sector is a question separate from the subgroups mentioned above. In contrast, the NAPM manufacturing sector composite index is a weighted average five components.
The seasonally adjusted prices index ticked higher to another record high of 74.6.
ISM surveys more than 370 purchasing managers in more than 62 industries including construction, law firms, hospitals, government and retailers. The non-manufacturing survey dates only to July 1997, therefore its seasonal adjustment should be viewed tentatively.
| ISM Non-manufacturing Survey | June | May | June '03 | 2003 | 2002 | 2001 |
|---|---|---|---|---|---|---|
| Business Activity Index | 59.9 | 65.2 | 59.5 | 58.1 | 55.1 | 48.9 |
| Prices Index | 74.6 | 74.4 | 52.7 | 56.7 | 53.9 | 51.5 |
by Tom Moeller July 6, 2004
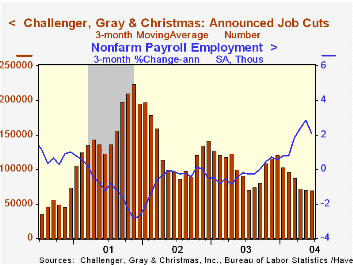
Challenger, Gray & Christmas reported that announced job cuts in June fell 12.3% m/m to 64,343, the lowest level in a year.
The three month moving average of job cut announcements fell to its lowest level since late 2000 (-23.6% y/y).
During the last ten years there has been an 86% (inverse) correlation between the three month moving average of announced job cuts and the three month change payroll employment.
Job cut announcements differ from layoffs. Many are achieved through attrition, early retirement or just never occur.
| Challenger, Gray & Christmas | June | May | Y/Y | 2003 | 2002 | 2001 |
|---|---|---|---|---|---|---|
| Announced Job Cuts | 64,343 | 73,368 | 7.8% | 1,236,426 | 1,431,052 | 1,956,876 |

Tom Moeller
AuthorMore in Author Profile »Prior to joining Haver Analytics in 2000, Mr. Moeller worked as the Economist at Chancellor Capital Management from 1985 to 1999. There, he developed comprehensive economic forecasts and interpreted economic data for equity and fixed income portfolio managers. Also at Chancellor, Mr. Moeller worked as an equity analyst and was responsible for researching and rating companies in the economically sensitive automobile and housing industries for investment in Chancellor’s equity portfolio. Prior to joining Chancellor, Mr. Moeller was an Economist at Citibank from 1979 to 1984. He also analyzed pricing behavior in the metals industry for the Council on Wage and Price Stability in Washington, D.C. In 1999, Mr. Moeller received the award for most accurate forecast from the Forecasters' Club of New York. From 1990 to 1992 he was President of the New York Association for Business Economists. Mr. Moeller earned an M.B.A. in Finance from Fordham University, where he graduated in 1987. He holds a Bachelor of Arts in Economics from George Washington University.
More Economy in Brief

 Global| Feb 05 2026
Charts of the Week: Balanced Policy, Resilient Data and AI Narratives
by:Andrew Cates

