 Global| Jan 24 2008
Japan’s Imports Hold Up As Exports Slow
Summary
Japan’s exports show a withering trend as Japan’s imports continue to rise at a brisk pace. Export and import price indexes, however, show that export volumes are being maintained better than the nominal figures tell us as export [...]
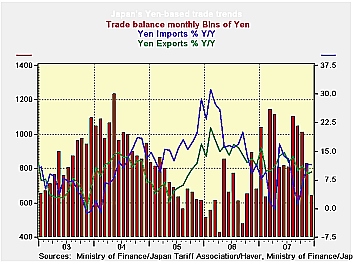
Japan’s exports show a withering trend as Japan’s imports continue to rise at a brisk pace. Export and import price indexes, however, show that export volumes are being maintained better than the nominal figures tell us as export prices are falling and falling faster than nominal exports are shrinking. Imports on the other hand are not as strong as nominal figures show since prices are rising sharply. While imports are up by 37% in the past three months from August to November, import prices rose by less at 35.8% for October through December. As a result Japan’s nominal trade figures give exactly the opposite impression of what is going on.
Nominal imports are rising, while real imports are actually
slowing. On the export side nominal exports are falling, but export
volumes are in fact still expanding. Rising oil prices are creating a
misdirection in terms of import trends. For exports, the rise in the
yen accounts for the drop in export prices. The yen’s rise tends to
result in a reduction of yen export prices, as though exports are
denominated in foreign currency. Volume still seems to be rising, but
if this is a currency effect it could be a warning that profits for
exports are in for a set back.
| Japan Trade Trends | |||||||
|---|---|---|---|---|---|---|---|
| in period level of % chg | Average in period/or % change | ||||||
| All data yen basis | Dec-07 | Nov-07 | Oct-07 | 3Mo Prev | 6Mo Prev | 12Mos Prev | 12 mo Ago |
| Balance on Goods | -- | 11,959 | 13,141 | 11,929 | 11,196 | 10,628 | 7,838 |
| % m/m | % saar | ||||||
| Exports Goods % | 0.9% | 0.6% | 1.9% | 1.5% | 6.9% | 9.6% | 22.1% |
| Motor Vehicles | 2.5% | -3.9% | 17.9% | -6.1% | 11.3% | 16.2% | 40.7% |
| Imports Goods % | 3.9% | 3.6% | 2.9% | 35.8% | 13.7% | 11.4% | 24.1% |
| Motor Vehicles | -25.2% | -7.5% | 9.8% | -84.4% | -53.1% | -27.4% | -23.3% |
| Prices in %, SAAR | 3-Mos | 6-Mos | 12-Mos | 12 mos Ago | |||
| Export Prices | 0.1% | -1.3% | 0.7% | -5.3% | -10.4% | -1.8% | 1.4% |
| Import Prices | 4.9% | 0.7% | 3.8% | 37.2% | 10.0% | 12.6% | 6.6% |
| Memo: Yen/$, AVG, Level | 112.45 | 111.07 | 115.87 | 113.13 | 115.43 | 117.76 | 116.35 |
| Memo Yen Percent ('-' is a fall) | -1.2% | 4.1% | -0.7% | 13.9% | 16.0% | 4.2% | 1.0% |

Robert Brusca
AuthorMore in Author Profile »Robert A. Brusca is Chief Economist of Fact and Opinion Economics, a consulting firm he founded in Manhattan. He has been an economist on Wall Street for over 25 years. He has visited central banking and large institutional clients in over 30 countries in his career as an economist. Mr. Brusca was a Divisional Research Chief at the Federal Reserve Bank of NY (Chief of the International Financial markets Division), a Fed Watcher at Irving Trust and Chief Economist at Nikko Securities International. He is widely quoted and appears in various media. Mr. Brusca holds an MA and Ph.D. in economics from Michigan State University and a BA in Economics from the University of Michigan. His research pursues his strong interests in non aligned policy economics as well as international economics. FAO Economics’ research targets investors to assist them in making better investment decisions in stocks, bonds and in a variety of international assets. The company does not manage money and has no conflicts in giving economic advice.
More Economy in Brief

 Global| Feb 05 2026
Charts of the Week: Balanced Policy, Resilient Data and AI Narratives
by:Andrew Cates

