 Global| Jun 07 2002
May Payrolls Weak, but the Jobless Rate Fell
by:Tom Moeller
|in:Economy in Brief
Summary
Payrolls rose somewhat less than expected last month and the modest gain in April payrolls was revised down. The Establishment Survey of nonfarm payrolls, hours, and earnings was revised to reflect annual benchmark adjustments and [...]
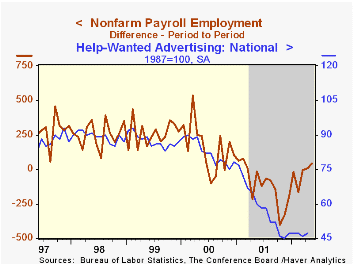
Payrolls rose somewhat less than expected last month and the modest gain in April payrolls was revised down.
The Establishment Survey of nonfarm payrolls, hours, and earnings was revised to reflect annual benchmark adjustments and updated seasonal adjustment factors. Revisions were small.
Despite the weakness in nonfarm payrolls, the unemployment rate fell unexpectedly. Household employment rose 441,000 (-0.6% y/y) and the labor force rose 199,000 (0.9% y/y).
The one-month diffusion index for nonfarm payrolls rose to 50.6, the first month above 50 since last March. This breadth of change measure was reported last month rising to 50.7 for April but that was revised down to 49.7.
Factory sector jobs continued to fall, down 11.2% versus the peak in April 1998. The one month diffusion index for the factory sector fell to 46.7%.
Construction sector jobs (-2.6% y/y) fell for the fifth month this year.
Employment in the service sector (-0.2% y/y) rose moderately for the third consecutive month.
The index of aggregate hours worked (employment times hours worked) fell 0.1% and so far in 2Q is up just slightly from the 1Q average.
Average hourly earnings rose a less than expected 0.2%.
The employment figures for nonfarm payrolls are based on reports provided to the US Labor Department by businesses, while the figures from which the unemployment rate is derived are based on a survey of US households.
| Employment | May | April | Y/Y | 2001 | 2000 | 1999 |
|---|---|---|---|---|---|---|
| Payroll Employment | 41,000 | 6,000 | -1.1% | 0.2% | 2.2% | 2.4% |
| Manufacturing | -19,000 | -22,000 | -6.1% | -4.2% | -0.4% | -1.3% |
| Average Weekly Hours | 34.2 | 34.2 | 34.2 | 34.2 | 34.4 | 34.5 |
| Average Hourly Earnings | 0.2% | 0.1% | 3.2% | 4.1% | 3.9% | 3.6% |
| Unemployment Rate | 5.8% | 6.0% | 4.4% | 4.8% | 4.0% | 4.2% |

Tom Moeller
AuthorMore in Author Profile »Prior to joining Haver Analytics in 2000, Mr. Moeller worked as the Economist at Chancellor Capital Management from 1985 to 1999. There, he developed comprehensive economic forecasts and interpreted economic data for equity and fixed income portfolio managers. Also at Chancellor, Mr. Moeller worked as an equity analyst and was responsible for researching and rating companies in the economically sensitive automobile and housing industries for investment in Chancellor’s equity portfolio. Prior to joining Chancellor, Mr. Moeller was an Economist at Citibank from 1979 to 1984. He also analyzed pricing behavior in the metals industry for the Council on Wage and Price Stability in Washington, D.C. In 1999, Mr. Moeller received the award for most accurate forecast from the Forecasters' Club of New York. From 1990 to 1992 he was President of the New York Association for Business Economists. Mr. Moeller earned an M.B.A. in Finance from Fordham University, where he graduated in 1987. He holds a Bachelor of Arts in Economics from George Washington University.
More Economy in Brief

 Global| Feb 05 2026
Charts of the Week: Balanced Policy, Resilient Data and AI Narratives
by:Andrew Cates

