 Global| Oct 26 2005
Mortgage Applications Backed Down
by:Tom Moeller
|in:Economy in Brief
Summary
The total number of mortgage applications reversed course last week and fell 7.9% after rising 6.1% the prior period according to the Mortgage Bankers Association. The decline pulled the average level in October 5.9% below September. [...]

The total number of mortgage applications reversed course last week and fell 7.9% after rising 6.1% the prior period according to the Mortgage Bankers Association. The decline pulled the average level in October 5.9% below September.
Purchase applications reversed more than all of the prior week's rise and fell 7.4%, placing the October average 2.8% below September's which rose 1.0% from August. During the last ten years there has been a 49% correlation between the y/y change in purchase applications and the change in new plus existing single family home sales.
Applications to refinance cratered 8.5% w/w to the lowest level since April and the October average is down 9.8% from September.
The effective interest rate on a conventional 30-year mortgage fell slightly to 6.30% from 6.35% the prior week. The low for 30 year financing was 5.71% in late June. The effective rate on a 15-year mortgage fell to 5.90%. The interest rate on 15 and 30 year mortgages are closely correlated (>90%) with the rate on 10 year Treasury securities.
The Mortgage Bankers Association surveys between 20 to 35 of the top lenders in the U.S. housing industry to derive its refinance, purchase and market indexes. The weekly survey accounts for more than 40% of all applications processed each week by mortgage lenders. Visit the Mortgage Bankers Association site here.
Cash-Out Refinancing: Check It Out Carefully from the Federal Reserve Bank of St. Louis is available here.
| MBA Mortgage Applications (3/16/90=100) | 10/21/05 | 10/14/05 | Y/Y | 2004 | 2003 | 2002 |
|---|---|---|---|---|---|---|
| Total Market Index | 679.1 | 737.5 | -3.5% | 735.1 | 1,067.9 | 799.7 |
| Purchase | 466.4 | 503.9 | 5.8% | 454.5 | 395.1 | 354.7 |
| Refinancing | 1,916.8 | 2,095.7 | -14.2% | 2,366.8 | 4,981.8 | 3,388.0 |
by Tom Moeller October 26, 2005
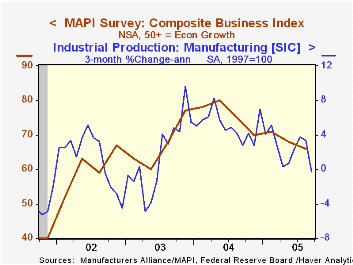
The 3Q '05 Composite Business Index published by the Manufacturers' Alliance/MAPI fell to 66 from 68 the prior quarter. The latest is the lowest level since 2Q '03.
During the last ten years there has been a 66% correlation between the Composite Index Level and quarterly growth in US factory sector output.
The current orders index continued lower to 81 and is down from the peak of 93, yet the index remained up sharply from the low of 30 during 2001.
The 3Q export orders index fell to 68 and earlier figures were revised lower. During the last ten years there has been a 73% correlation between the export orders index and the y/y change in real US exports.
The profit margins index slipped slightly to 60 from 61 in 2Q but was well off last year's highs of 73.Capital spending intentions for the coming year moved lower q/q but the trend continued the sideways movement in place since late 2003. During the last ten years there has been a 74% correlation between the capital spending index a y/y growth in business investment in equipment & software.
For the latest US Business Outlook from the MAPI click here.
| Manufacturers' Alliance/MAPI Survey | 3Q '05 | 2Q '05 | 3Q '04 | 2004 | 2003 | 2002 |
|---|---|---|---|---|---|---|
| Composite Business Index | 66 | 68 | 75 | 76 | 67 | 60 |
by Carol Stone October 26, 2005
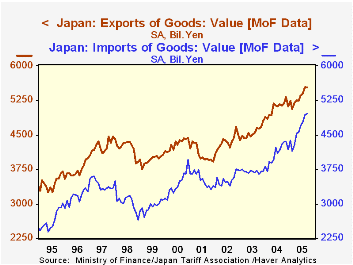
The Japanese trade balance continues to diminish, a direct reflection of its need to import nearly all of the petroleum it uses. In September, the surplus was ¥556.5 billion (seasonally adjusted), down from ¥610.6 in August, ¥828.3 billion in September 2004 and nearly ¥1 trillion on average for all of 2004. This is not the fault of Japan's exports performance. Foreign shipment are expanding nicely; in September they did edge down ¥15 million from ¥5.544 trillion (seasonally adjusted) in August, but that figure was a record, and up more than 9% from a year earlier.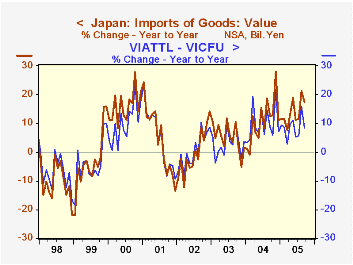
But imports grew faster still. They were ¥4.973 billion in September, up 17.4% from the year-ago month, following year-on-year growth of 21.2% in August. These are not the fastest growth rates for imports ever in Japan, far from it. But they show the sensitivity of Japan's import picture to petroleum. The last time there were sustained increases of this magnitude was the winter of 2000-2001 when petroleum and natural gas prices were accelerating rapidly. Excluding the mineral fuel category, other Japanese imports were up 8.3% in September. Imports from China are an important part of import growth as well; they were up 11.9% on the last 12 months. Chinese goods now hold a 29.5% share of imports excluding mineral fuels compared with 26.5% on average last year and 22.7% as recently as 2002.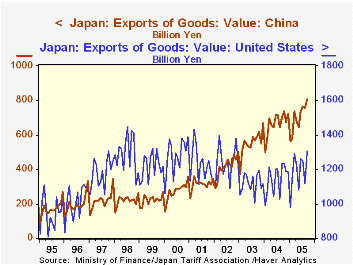
At the same time, China is also a big market for exports of Japanese products. While it is not nearly as large a customer as the US, it seems to be working hard to catch up. As seen in the table below, its share of Japanese exports has increased by 4 percentage points since 2002, while the US share is down about 6-1/2 points. Other nations picking up market share for Japanese goods include India and Eastern Europe. So Japan's trading is clearly widespread and becoming more so all the time. Such diverse export gains can help it pay for the expensive oil it must buy.
| Japan: Bil.¥ NSA except as noted |
Sept 2005 | Aug 2005 | July 2005 | Sept 2004 | Monthly Averages|||
|---|---|---|---|---|---|---|---|
| 2004 | 2003 | 2002 | |||||
| Trade Balance (SA) | 556.5 | 610.6 | 604.3 | 828.3 | 996.5 | 843.9 | 823.2 |
| Exports | 5925.3 | 5220.6 | 5536.9 | 5445.8 | 5097.5 | 4545.7 | 4342.4 |
| To US % of Total | 22.0 | 21.3 | 22.6 | 22.7 | 22.4 | 24.6 | 28.5 |
| To China % of Total | 13.6 | 14.5 | 13.8 | 12.9 | 13.1 | 12.2 | 9.6 |
| Sum | 35.6 | 35.8 | 36.4 | 35.6 | 35.5 | 36.8 | 38.1 |
| Imports | 4968.3 | 5106.8 | 4668.1 | 4232.6 | 4101.4 | 3696.8 | 3519.0 |
| Ex Mineral Fuels | 3575.0 | 3722.1 | 3469.6 | 3300.1 | 3212.2 | 2917.7 | 2837.8 |
| China % of Total | 21.3 | 20.5 | 20.3 | 22.3 | 20.7 | 19.7 | 18.3 |
| China % of Non- Min Fuel | 29.5 | 28.1 | 27.3 | 28.6 | 26.5 | 24.9 | 22.7 |
Tom Moeller
AuthorMore in Author Profile »Prior to joining Haver Analytics in 2000, Mr. Moeller worked as the Economist at Chancellor Capital Management from 1985 to 1999. There, he developed comprehensive economic forecasts and interpreted economic data for equity and fixed income portfolio managers. Also at Chancellor, Mr. Moeller worked as an equity analyst and was responsible for researching and rating companies in the economically sensitive automobile and housing industries for investment in Chancellor’s equity portfolio. Prior to joining Chancellor, Mr. Moeller was an Economist at Citibank from 1979 to 1984. He also analyzed pricing behavior in the metals industry for the Council on Wage and Price Stability in Washington, D.C. In 1999, Mr. Moeller received the award for most accurate forecast from the Forecasters' Club of New York. From 1990 to 1992 he was President of the New York Association for Business Economists. Mr. Moeller earned an M.B.A. in Finance from Fordham University, where he graduated in 1987. He holds a Bachelor of Arts in Economics from George Washington University.
More Economy in Brief
 Global| Feb 05 2026
Charts of the Week: Balanced Policy, Resilient Data and AI Narratives
by:Andrew Cates


