 Global| Jan 27 2012
New Leading Credit Index Gives Mixed Signals for Total Economy
Summary
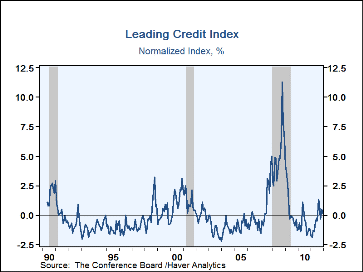
With The Conference Board's release yesterday of the December leading indicator index, they included a brand new measure of financial market forces, which they call the Leading Credit Index. In December, it rose 0.2%; it enters the [...]
With The Conference Board's release yesterday of the December leading indicator index, they included a brand new measure of financial market forces, which they call the Leading Credit Index. In December, it rose 0.2%; it enters the total Leading Economic Index (LEI) on an inverted basis, so this increase subtracted 0.02% from the LEI.
The new index came about as one of the first products of a comprehensive review of the leading indicators by Conference Board analysts, the first such exercise since 1996, when the Conference Board took over production of the indicators from the U.S. Commerce Department. The analysts developed methods for assessing the indicators' reliability by using probit analysis and Markov Switching models. These are numerical procedures and are not based on any over-riding philosophical view of the economy's structure. The point is to identify a collection of indicators that point most reliably to turning points in the overall economy. One of the first outcomes of their analysis was that if they dropped M2 from the total leading index, the remaining indicators performed much better after 1990 than the current leading index. Thus, they set out to develop a new financial indicator.
This new index is a composite of six items covering varying aspects of financial market activity. These items include
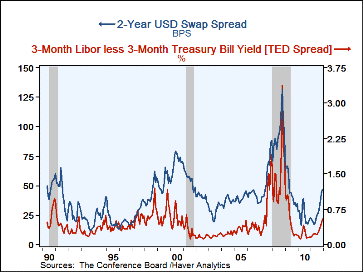
1. 2-year Swap Spread
2. 3-month LIBOR vs. Treasury bill yield
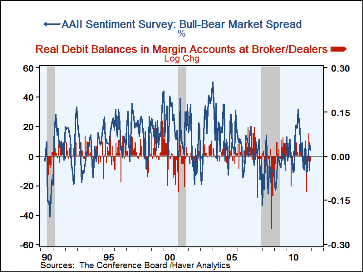
3. Debit balances in margin accounts at broker/dealers
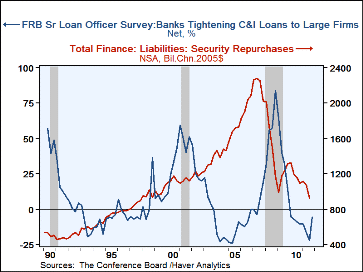
4. Fed Senior Loan Officer Survey, % of banks tightening C&I loan availability
5. AAII investor sentiment survey, net bullish - bearish spread
6. Flow-of-funds accounts: security repurchase agreements ("repos")
Other financial indicators in the overall leading index include the yield curve, that is, 10-year Treasury yield - fed funds rate, and the S&P 500 stock price index. So the Conference Board economists wanted a measure that was not "price" oriented. The two rate spreads measure credit quality and risk. The margin balances at brokers and the AAII bullish-bearish spread measure investor willingness to speculate. The other two items describe credit availability in the banking system and in the so-called shadow-banking system. Importantly, as we noted above, the LCI enters the leading index on an inverted basis, so wider spreads, greater speculative investing and tighter credit combine to describe an economy preparing to slow, weaken or decline, whereas narrower spreads, reduced risk-taking and easier credit suggest that the economy might be preparing to reach bottom and turn higher.
In the December report, the LCI rose somewhat, thus detracting a bit from the total leading index. This came about because the swap spread and the LIBOR-Tbill spread both widened, margin balances were less negative and bank lending standards were not as easy as they had been earlier. However, the AAII investor survey remained bullish on balance for a third month, but the December reading eased somewhat from November. These developments suggest that the financial forces on the economy remain mixed and tenuous. Notice that the recent changes in these items are best described in the second derivative: margin balances have been declining and only declined less in December, rather than turning upward. They are also down on balance for the last several months. The AAII survey, which covers individual "retail" investors, showed some bullishness, but less so, rather than shifting to a negative reading. Bank lending had been very easy, with the tightening - easing spread at -21.8% in Q3, and then -5.9% in Q4, not an outright shift to "tight", but "less easy". These developments are all the hazier when pitched against the economy as a whole. Is it strengthening? Will it continue to do so? As Tom Moeller notes in his discussion of today's GDP report, one would expect a sharper bounce after the steep recession. The mixed performance of these financial indicators describes one specific area where support for the economy is coming and going from month to month, so it is no wonder that the economic outlook overall remains cloudy, even as the total leading indicator index suggests continued firming
These data are all contained in Haver's BCI database, and several components are contained in USECON, SURVEYW and FFUNDS databases.
| Leading Credit Index | Dec | Nov | Oct | 2011 | 2010 | 2009 | 2008 |
|---|---|---|---|---|---|---|---|
| Total, % change | 0.2 | 0.5 | -0.3 | -0.4 | -0.8 | 0.6 | 5.3 |
| Leading Economic Index total, % change | 0.4 | 0.2 | 0.6 | 0.2 | 0.5 | 0.2 | -1.6 |
| Contribution of LCI to LEI, % | -0.02 | -0.04 | 0.02 | 0.03* | 0.06* | -0.05* | -0.42* |
*average of 12 months
Carol Stone, CBE
AuthorMore in Author Profile »Carol Stone, CBE came to Haver Analytics in 2003 following more than 35 years as a financial market economist at major Wall Street financial institutions, most especially Merrill Lynch and Nomura Securities. She had broad experience in analysis and forecasting of flow-of-funds accounts, the federal budget and Federal Reserve operations. At Nomura Securities, among other duties, she developed various indicator forecasting tools and edited a daily global publication produced in London and New York for readers in Tokyo. At Haver Analytics, Carol was a member of the Research Department, aiding database managers with research and documentation efforts, as well as posting commentary on select economic reports. In addition, she conducted Ways-of-the-World, a blog on economic issues for an Episcopal-Church-affiliated website, The Geranium Farm. During her career, Carol served as an officer of the Money Marketeers and the Downtown Economists Club. She had a PhD from NYU's Stern School of Business. She lived in Brooklyn, New York, and had a weekend home on Long Island.
More Economy in Brief
 Global| Feb 05 2026
Charts of the Week: Balanced Policy, Resilient Data and AI Narratives
by:Andrew Cates


