 Global| Sep 30 2002
Personal Income and Spending Moderate
by:Tom Moeller
|in:Economy in Brief
Summary
Personal income (4.7% AR, YTD) rose slightly less than expected last month. July's figure was unrevised. Consensus expectations were for a 0.5% gain. Wage and salary disbursements (2.7% AR, YTD) rose 0.5% and recouped the 0.3% July [...]

Personal income (4.7% AR, YTD) rose slightly less than expected last month. July's figure was unrevised. Consensus expectations were for a 0.5% gain.
Wage and salary disbursements (2.7% AR, YTD) rose 0.5% and recouped the 0.3% July decline. Gains amongst industries were widespread though manufacturing wages remained down 2.9% versus last year. Personal transfer payments have risen at a 11.4% annual rate so far this year.
Personal consumption expenditures rose less than expected. Durable goods purchases rose 1.4%, but purchases of nondurables and services were weak, both rising just 0.2%.
Disposable income rose 0.4% (9.6% AR, YTD). Personal tax payments fell for the seventh month this year.
The PCE price deflator rose 0.2% following a 0.1% rise in July which was revised down. Prices were up 2.3% (AR, YTD). Less food and energy, the price deflator rose 0.3% (1.9% AR, YTD), the strongest monthly gain since April.
| Disposition of Personal Income | Aug | July | Y/Y | 2001 | 2000 | 1999 |
|---|---|---|---|---|---|---|
| Personal Income | 0.4% | 0.0% | 3.5% | 3.3% | 8.0% | 4.9% |
| Personal Consumption | 0.3% | 1.0% | 5.1% | 4.5% | 7.0% | 6.7% |
| Savings Rate | 3.6% | 3.5% | 4.5% | 2.3% | 2.8% | 2.7% |
| PCE Price Deflator | 0.2% | 0.1% | 1.4% | 2.0% | 2.5% | 1.6% |
by Tom Moeller September 30, 2002

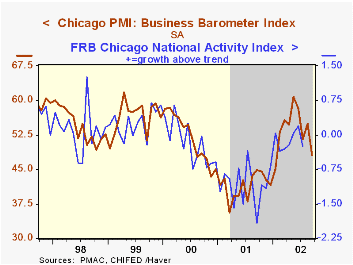
The Chicago Purchasing Manager’s Index of Business activity dropped more than expected in September. Consensus estimates were for slight decline to 53.0.
It was the first month since January the business activity index dropped below 50, the cutoff between expanding and contracting activity. An 87% correlation between the Chicago PMI and the ISM Composite Index suggests that index may be weak when released tomorrow.
The indexes of new orders, production, order backlogs, inventories and delivery speeds all fell. Employment rose.
The prices paid index fell sharply to the lowest level since April.
| Chicago Purchasing Managers Index, SA | Sept. | Aug | Y/Y | 2001 | 2000 | 1999 |
|---|---|---|---|---|---|---|
| Business Barometer | 48.1 | 54.9 | 44.9 | 41.4 | 51.8 | 56.5 |
| Prices Paid | 57.6 | 63.6 | 42.0 | 50.5 | 65.6 | 57.6 |
Tom Moeller
AuthorMore in Author Profile »Prior to joining Haver Analytics in 2000, Mr. Moeller worked as the Economist at Chancellor Capital Management from 1985 to 1999. There, he developed comprehensive economic forecasts and interpreted economic data for equity and fixed income portfolio managers. Also at Chancellor, Mr. Moeller worked as an equity analyst and was responsible for researching and rating companies in the economically sensitive automobile and housing industries for investment in Chancellor’s equity portfolio. Prior to joining Chancellor, Mr. Moeller was an Economist at Citibank from 1979 to 1984. He also analyzed pricing behavior in the metals industry for the Council on Wage and Price Stability in Washington, D.C. In 1999, Mr. Moeller received the award for most accurate forecast from the Forecasters' Club of New York. From 1990 to 1992 he was President of the New York Association for Business Economists. Mr. Moeller earned an M.B.A. in Finance from Fordham University, where he graduated in 1987. He holds a Bachelor of Arts in Economics from George Washington University.
More Economy in Brief
 Global| Feb 05 2026
Charts of the Week: Balanced Policy, Resilient Data and AI Narratives
by:Andrew Cates


