 Global| Sep 20 2007
Personal Income Growth Slows in Most States in Q2 after Bonuses Paid in Q1; Commuting Patterns Require Adjustment [...]
Summary
Today, the BEA reported personal income by state for Q2. This sizable body of data, carried in Haver's PIQR database, shows the composition of aggregate personal income for each state by type of income and earnings by industry. In Q2 [...]

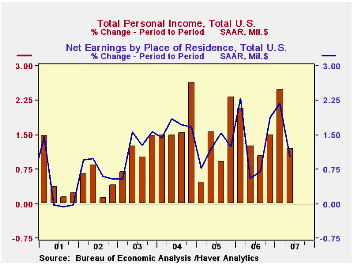
Today, the BEA reported personal income by state for Q2. This sizable body of data, carried in Haver's PIQR database, shows the composition of aggregate personal income for each state by type of income and earnings by industry. In Q2 total personal income for the country grew 1.2%, following 2.5% in Q1. Q1 had included the payment of large bonuses covering year-end 2006, and these enlarged the income growth reported for Q1 and the apparent slowdown in Q2. The year-on-year growth in Q2 personal income, though, was 6.4%, well in line with the performance of the last three years. Similarly, earnings rose 1.0% in Q2 compared with 2.2% in Q1; the year-on-year growth was 5.9%, also running about average with recent years' experience. These data levels are given in seasonally adjusted annual rates, but the % changes are cited as quarterly rates by BEA.
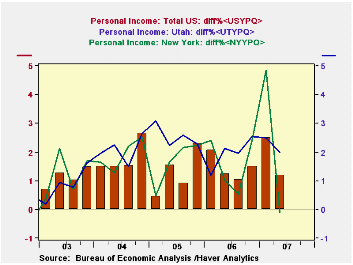
By state, personal income grew as much as 2.0% in Q2 in Utah and it declined outright in New York -- by 0.1%. New York workers had received the biggest part of the Q1 bonus money and income there then expanded by 4.8%. So the decline in Q2 should be seen as weak only relative to the bulge in Q1 growth. In Utah, the big Q2 gains income came in earnings, with outsized gains in professional and technical industries, durable goods manufacturing and construction.
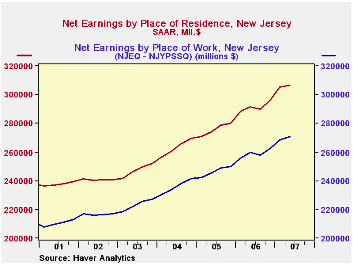
This report highlights a special feature of state income data. Income is measure according to residence; I live and work in New York, for instance, so all of my income occurs in New York. But earnings are compiled from establishment data, so they represent earnings were people work, which is not necessarily the state they they live in. Adjustment is needed to reconcile these differences Our data table below shows two states with a noticeable impact from commuters. Many New Jerseyans work in New York. So earnings (defined here as wages and salaries net of contributions for social insurance) defined by residence are larger in New Jersey than those reported for workers. So we see that the "worker" data are increased by a positive factor, which was $35.9 billion in Q2, or 11.7% of earnings of residents.
In contrast, many people who work in Missouri live in Kansas or Illinois. So Missouri has a negative "residence adjustment". In Q2 it was $4.3 billion, or 2.8% of earnings reported for workers in the state. That is, 2.8% of earnings earned in Missouri was transferred to other states where the workers actually reside.
Most states have a negligible residence adjustment since nearly everyone lives and works in the same state. But all states have even a small amount. And the country as a whole has a tiny but negative residence adjustment, since some people who work in the US live in another country.[Note that these personal income data are compiled separately from the personal income reported in the National Income Accounts. The differences would be the subject of another commentary, but for now, it is enough to say that the sum of the states need not equal the total of personal income in the more familiar national data. It are quite close, however.]


| Personal Income by State | Q2 2007 | Q1 2007 | Q4 2006 | Year Ago | 2006 | 2005 | 2004 |
|---|---|---|---|---|---|---|---|
| Personal Income, Total US | 11,595 | 11,459 | 11,181 | 10,902 | 10,967 | 10,284 | 9,711 |
| % Change | 1.2 | 2.5 | 1.5 | 6.4 | 6.6 | 5.9 | 6.1 |
| Net Earnings by Residence | 7,893 | 7,812 | 7,646 | 7,453 | 7,504 | 7,104 | 6,739 |
| % Change | 1.0 | 2.2 | 1.9 | 5.9 | 5.6 | 5.4 | 6.5 |
| Earnings by State | |||||||
| New Jersey | 307 | 305 | 296 | 291 | 291 | 276 | 263 |
| % Change | 0.5 | 3.0 | 2.3 | 5.2 | 5.7 | 4.8 | 6.4 |
| Residence Adjustment | 35.9 | 36.7 | 33.7 | 31.7 | 32.5 | 29.1 | 26.9 |
| Missouri | 132 | 131 | 129 | 127 | 127 | 121 | 117 |
| % Change | 1.3 | 1.5 | 1.7 | 4.5 | 4.4 | 4.1 | 5.5 |
| Residence Adjustment | -4.3 | -4.3 | -4.2 | -4.3 | -4.2 | -4.2 | -3.8 |
Carol Stone, CBE
AuthorMore in Author Profile »Carol Stone, CBE came to Haver Analytics in 2003 following more than 35 years as a financial market economist at major Wall Street financial institutions, most especially Merrill Lynch and Nomura Securities. She had broad experience in analysis and forecasting of flow-of-funds accounts, the federal budget and Federal Reserve operations. At Nomura Securities, among other duties, she developed various indicator forecasting tools and edited a daily global publication produced in London and New York for readers in Tokyo. At Haver Analytics, Carol was a member of the Research Department, aiding database managers with research and documentation efforts, as well as posting commentary on select economic reports. In addition, she conducted Ways-of-the-World, a blog on economic issues for an Episcopal-Church-affiliated website, The Geranium Farm. During her career, Carol served as an officer of the Money Marketeers and the Downtown Economists Club. She had a PhD from NYU's Stern School of Business. She lived in Brooklyn, New York, and had a weekend home on Long Island.
More Economy in Brief
 Global| Feb 05 2026
Charts of the Week: Balanced Policy, Resilient Data and AI Narratives
by:Andrew Cates


