 Global| May 19 2006
Philadelphia Fed Business Activity Up
by:Tom Moeller
|in:Economy in Brief
Summary
The May Index of General Business Conditions in the manufacturing sector from the Philadelphia Fed rose modestly, for the second month, to 14.4 from an unrevised 13.2 last month. The gain surpassed Consensus expectations for a decline [...]
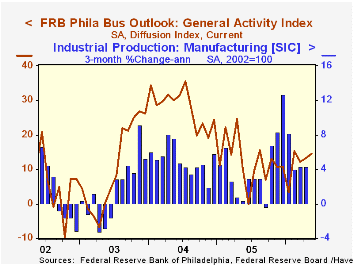
The May Index of General Business Conditions in the manufacturing sector from the Philadelphia Fed rose modestly, for the second month, to 14.4 from an unrevised 13.2 last month. The gain surpassed Consensus expectations for a decline to 12.5.
During the last ten years there has been a 65% correlation between the level of the Philadelphia Fed Business Conditions Index and three month growth in factory sector industrial production. There has been a 49% correlation with q/q growth in real GDP.
The index reflected improvement in delivery times and inventories. However, declines in other sub indexes were broad based; new orders, shipments and employment each fell to the lowest levels since last Summer. During the last ten years there has been a 75% correlation between the employment index and the three month growth in factory payrolls.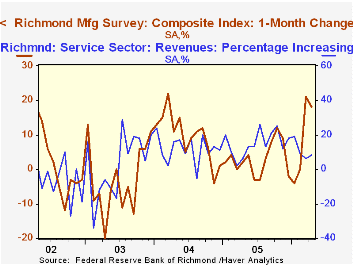
The business conditions index reflects a separate survey question, not the sub indexes.
The prices paid index surged to the highest level since last September. During the last ten years there has been a 76% correlation between the prices paid index and the three month growth in the intermediate goods PPI. There has been an 85% correlation with the change in core intermediate goods prices.
The separate index of expected business conditions in six months fell and reversed roughly half of the improvement in April. Expectations for employment fell sharply to the lowest level since August 2002..
The latest Business Outlook survey from the Philadelphia Federal Reserve Bank can be found here.
The rise in the Philly Fed index ran counter to the m/m improvement, reported Monday, in the May Empire State Manufacturing index of general business conditions. The Richmond Fed will report its May Mfg. Survey index next week. The reading will follow two months of sharp improvement, notably in orders, shipments and jobs and the figures will be available in the Haver SURVEYS database.
During the last ten years there has been a 57% correlation between the Richmond survey index level and the change in factory sector industrial production, nationally. The latest Richmond Fed Mfg. Survey is available here.
The Richmond Fed also publishes indexes of conditions in the Service Sector and the latest release is available here.
| Philadelphia Fed Business Outlook | May | April | May '05 | 2005 | 2004 | 2003 |
|---|---|---|---|---|---|---|
| General Activity Index | 14.4 | 13.2 | 10.3 | 12.4 | 28.0 | 10.5 |
| Prices Paid Index | 55.3 | 29.0 | 32.0 | 43.5 | 51.2 | 16.8 |

Tom Moeller
AuthorMore in Author Profile »Prior to joining Haver Analytics in 2000, Mr. Moeller worked as the Economist at Chancellor Capital Management from 1985 to 1999. There, he developed comprehensive economic forecasts and interpreted economic data for equity and fixed income portfolio managers. Also at Chancellor, Mr. Moeller worked as an equity analyst and was responsible for researching and rating companies in the economically sensitive automobile and housing industries for investment in Chancellor’s equity portfolio. Prior to joining Chancellor, Mr. Moeller was an Economist at Citibank from 1979 to 1984. He also analyzed pricing behavior in the metals industry for the Council on Wage and Price Stability in Washington, D.C. In 1999, Mr. Moeller received the award for most accurate forecast from the Forecasters' Club of New York. From 1990 to 1992 he was President of the New York Association for Business Economists. Mr. Moeller earned an M.B.A. in Finance from Fordham University, where he graduated in 1987. He holds a Bachelor of Arts in Economics from George Washington University.
More Economy in Brief

 Global| Feb 05 2026
Charts of the Week: Balanced Policy, Resilient Data and AI Narratives
by:Andrew Cates

