 Global| Dec 21 2017
Philadelphia Fed Factory Conditions Index Unexpectedly Strengthens in December
by:Sandy Batten
|in:Economy in Brief
Summary
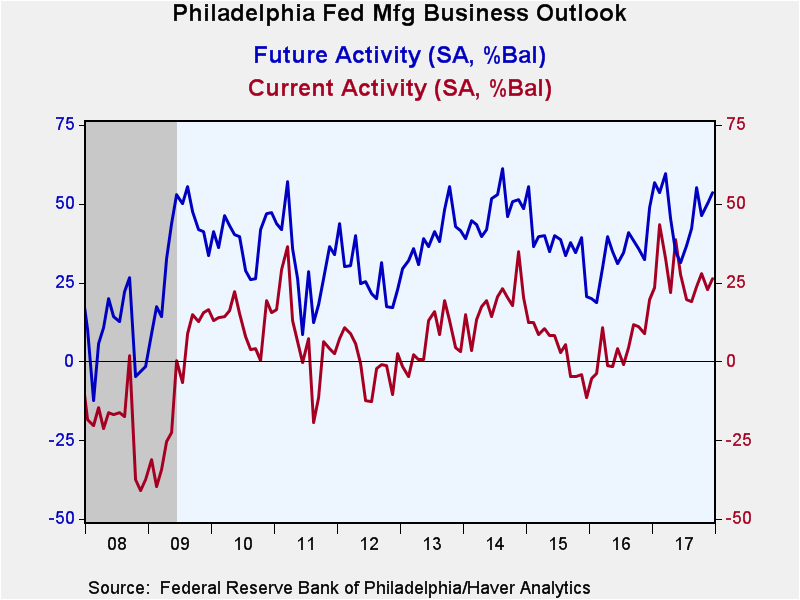
The Philadelphia Federal Reserve reported that its General Factory Sector Business Conditions Index rose to 26.2 in December from 22.7 in November. Expectations had been for a reading of 20.5 in the Action Economics Forecast Survey. [...]
The Philadelphia Federal Reserve reported that its General Factory Sector Business Conditions Index rose to 26.2 in December from 22.7 in November. Expectations had been for a reading of 20.5 in the Action Economics Forecast Survey. Nearly 41% of firms reported an improvement in business activity while less than 15% reported a decrease. This statistic is a diffusion index centered on zero; so readings above zero indicate expansion and increases above zero indicate a faster pace of expansion.
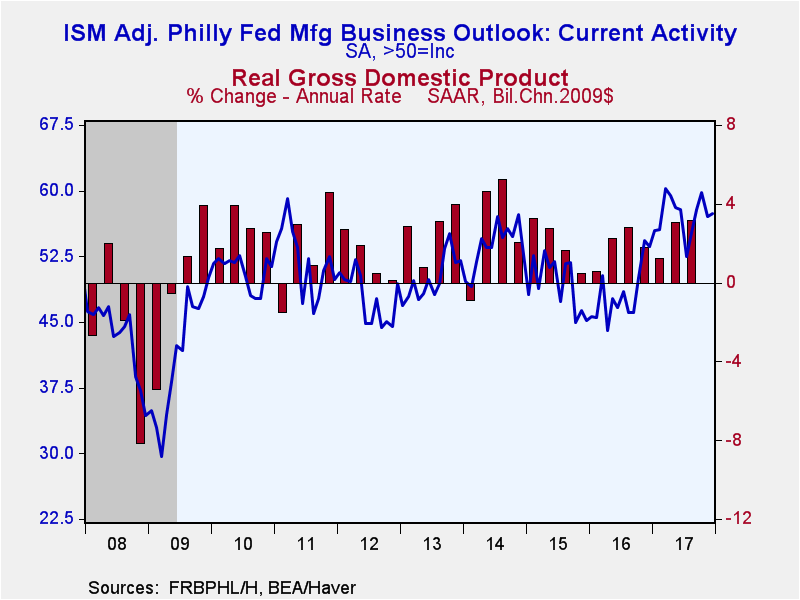
In contrast to the ISM index, the headline Philadelphia Fed index is not constructed from some of its key components but rather reflects the respondents' answer to a separate question. Using the Philadelphia Fed data, Haver Analytics constructs an ISM-Adjusted General Business Conditions Index in the same manner as the ISM index. This measure rose to 57.4 for December from 57.0 for November. During the last ten years, there has been more than an 80% correlation between the quarterly ISM-adjusted Philadelphia Fed Index and annual real GDP growth.
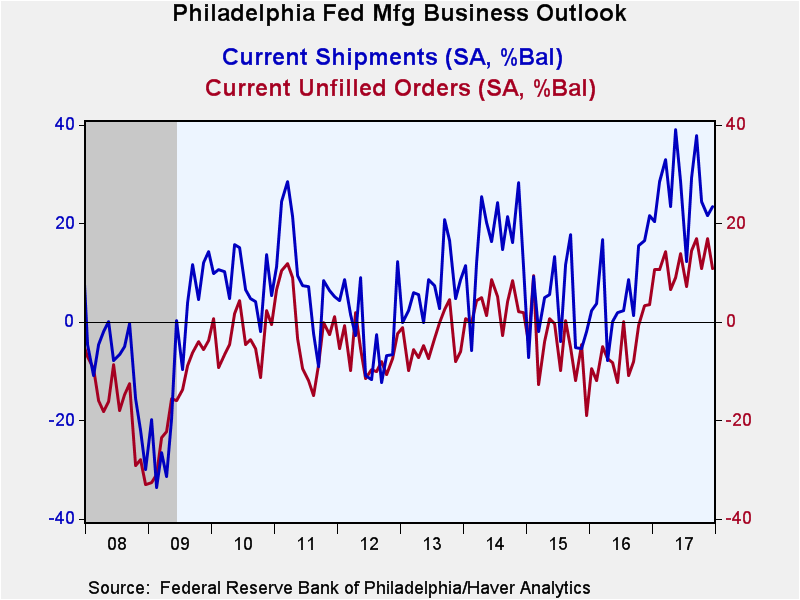
While performance of the subindexes was mixed in December, two key components--new orders and shipments--exhibited meaningful monthly increases. Both components that measure employment conditions fell, but remained in positive territory (meaning that employment conditions improved in December but at a slower pace than in November). Compared to a year ago, both the headline index and the subindexes are generally stronger.
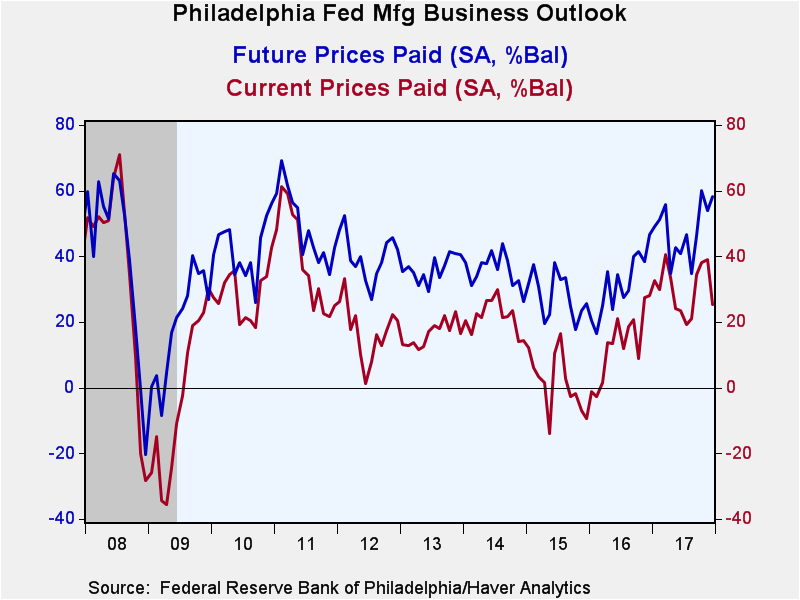
The prices paid measure retreated to 25.4 from its ultra-elevated 39.0 reading in November--most likely reflecting a general softening of energy prices after an earlier hurricane-related boost. 25.8% of respondents reported paying higher prices in December, down sharply from 39.0% in November.
The index measuring expected business conditions in six months rose to 53.5 in December from 50.1 in November. As was the case for the current conditions reading, the subindexes for new orders and shipments posted meaningful gains in December. The reading on future capital expenditures remained elevated, rising to 38.0 in December from 36.7 in November though it remained below its recent peak of 42.0 in July.
The survey panel consists of 150 manufacturing companies in the third Federal Reserve District (which consists of southeastern PA, southern NJ and Delaware). The diffusion indexes represent the percentage of respondents indicating an increase minus the percentage indicating a decrease in activity. The ISM-adjusted figure, calculated by Haver Analytics, is the average of five diffusion indexes: new orders, production, employment, supplier deliveries and inventories with equal weights (20% each). Each ISM-adjusted index is the sum of the percent responding "higher" and one-half of the percent responding "same."
The figures from the Philadelphia Federal Reserve can be found in Haver's SURVEYS database. The expectation from the Action Economics Forecast Survey is available in AS1REPNA.
| Philadelphia Fed - Manufacturing Business Outlook Survey (%, SA) | Dec | Nov | Oct | Dec'16 | 2017 | 2016 | 2015 |
|---|---|---|---|---|---|---|---|
| General Factory Sector Business Conditions | 26.2 | 22.7 | 27.9 | 19.7 | 27.3 | 4.8 | 3.6 |
| ISM-Adjusted Business Conditions | 57.4 | 57.0 | 59.8 | 53.6 | 57.2 | 48.2 | 49.4 |
| New Orders | 29.8 | 21.4 | 19.6 | 14.9 | 25.3 | 4.9 | 3.0 |
| Shipments | 23.4 | 21.7 | 24.4 | 21.7 | 26.8 | 6.9 | 3.1 |
| Unfilled Orders | 10.8 | 17.0 | 10.9 | 3.6 | 11.9 | -5.5 | -5.1 |
| Delivery Time | 10.9 | 14.6 | 21.6 | 5.4 | 10.6 | -4.6 | -4.1 |
| Inventories | -1.6 | -8.6 | 6.0 | 1.3 | 2.8 | -9.7 | -1.5 |
| Number of Employees | 18.1 | 22.6 | 30.6 | 3.6 | 16.1 | -5.7 | 3.9 |
| Average Workweek | 10.6 | 13.7 | 19.4 | 7.1 | 14.9 | -5.5 | -1.8 |
| Prices Paid | 25.4 | 39.0 | 38.1 | 28.1 | 30.1 | 13.5 | 1.5 |
| Expectations - General Business Conditions; Six Months Ahead | 53.5 | 50.1 | 46.4 | 48.7 | 47.1 | 33.7 | 37.6 |
Sandy Batten
AuthorMore in Author Profile »Sandy Batten has more than 30 years of experience analyzing industrial economies and financial markets and a wide range of experience across the financial services sector, government, and academia. Before joining Haver Analytics, Sandy was a Vice President and Senior Economist at Citibank; Senior Credit Market Analyst at CDC Investment Management, Managing Director at Bear Stearns, and Executive Director at JPMorgan. In 2008, Sandy was named the most accurate US forecaster by the National Association for Business Economics. He is a member of the New York Forecasters Club, NABE, and the American Economic Association. Prior to his time in the financial services sector, Sandy was a Research Officer at the Federal Reserve Bank of St. Louis, Senior Staff Economist on the President’s Council of Economic Advisors, Deputy Assistant Secretary for Economic Policy at the US Treasury, and Economist at the International Monetary Fund. Sandy has taught economics at St. Louis University, Denison University, and Muskingun College. He has published numerous peer-reviewed articles in a wide range of academic publications. He has a B.A. in economics from the University of Richmond and a M.A. and Ph.D. in economics from The Ohio State University.


