 Global| Aug 19 2010
Philly Fed Business Outlook Survey Negative for August: Renewed Weakness? -- or Routine Shakiness?
Summary
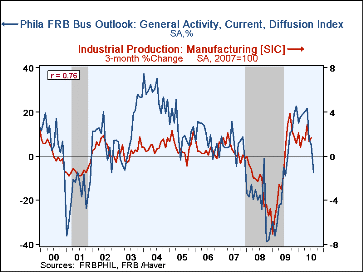
Disappointingly, the Philadelphia Fed's monthly business outlook survey turned negative for this month. The general activity index was -7.7% compared with July's +5.1%. It was the first negative reading since July 2009. The weakness [...]
 Disappointingly, the Philadelphia Fed's monthly business outlook survey turned negative for this month. The general activity index was -7.7% compared with July's +5.1%. It was the first negative reading since July 2009.
The weakness pervaded the survey results. New orders have a -7.1% reading, down from -4.3% in July and +9.0% in June. Shipments shifted to the downside, from +4.0% in July to -4.5% for August. As seen in the table below, delivery times shortened at more and more firms, inventory levels went down and the number of employees fell for a second out of the last three months.
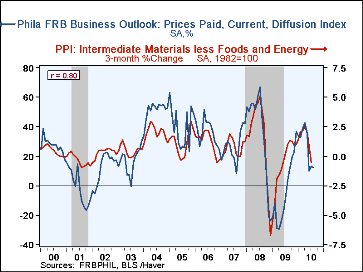
The relative movements of prices suggest some pressure on profits as well. Prices paid for materials and supplies increased at 11.8% of firms on balance, about in line with the prior couple of months. But selling prices decreased at more firms than they had the prior two months and are now running negative after an encouraging run of modest increases for five of the six preceding months through May.
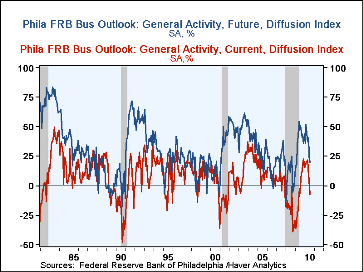
The accompanying results for expectations of activity and pricing six months from now also deteriorated. These remain positive for the most part, but the general index, for example, fell to 19.6% in August from 25.0% in July and reached the lowest level since 18.5% in March 2009. One might imagine that managers would have more positive expectations during periods of declining business, and that after a recovery is under way, they might moderate their views. This seems to be the case in this period, as a longer-range look at the data -- in the third graph -- shows that the current pattern has been seen before in the months after the conclusion of a recession.
We're also impressed with the fact that this graph shows that the current conditions index occasionally turns negative during cyclical expansions, so perhaps the current downshift is a temporary adjustment, not a sign of renewed broad decline. Wishful thinking?
| Philadelphia Fed Business Outlook (%) | August | July | June | August 2009 | 2009 | 2008 | 2007 |
|---|---|---|---|---|---|---|---|
| General Activity Index | -7.7 | 5.1 | 8.0 | 0.0 | -7.6 | -21.4 | 5.0 |
| New Orders | -7.1 | -4.3 | 9.0 | 2.1 | -9.7 | -14.7 | 6.9 |
| Shipments | -4.5 | 4.0 | 14.2 | -2.0 | -8.0 | -9.2 | 9.9 |
| Delivery Times | -11.0 | -8.1 | 6.8 | -9.9 | -15.3 | -10.6 | -6.1 |
| Inventories | -11.6 | 4.5 | 4.6 | -4.7 | -24.0 | -16.7 | -3.7 |
| Number of Employees | -2.7 | 4.0 | -1.5 | -17.6 | -23.8 | -8.8 | 6.8 |
| Prices Paid | 11.8 | 13.1 | 10.0 | 3.7 | -3.9 | 36.3 | 26.3 |
| Prices Received | -12.5 | -8.4 | -6.5 | -5.9 | -18.4 | 16.2 | 9.6 |
Carol Stone, CBE
AuthorMore in Author Profile »Carol Stone, CBE came to Haver Analytics in 2003 following more than 35 years as a financial market economist at major Wall Street financial institutions, most especially Merrill Lynch and Nomura Securities. She had broad experience in analysis and forecasting of flow-of-funds accounts, the federal budget and Federal Reserve operations. At Nomura Securities, among other duties, she developed various indicator forecasting tools and edited a daily global publication produced in London and New York for readers in Tokyo. At Haver Analytics, Carol was a member of the Research Department, aiding database managers with research and documentation efforts, as well as posting commentary on select economic reports. In addition, she conducted Ways-of-the-World, a blog on economic issues for an Episcopal-Church-affiliated website, The Geranium Farm. During her career, Carol served as an officer of the Money Marketeers and the Downtown Economists Club. She had a PhD from NYU's Stern School of Business. She lived in Brooklyn, New York, and had a weekend home on Long Island.
More Economy in Brief
 Global| Feb 05 2026
Charts of the Week: Balanced Policy, Resilient Data and AI Narratives
by:Andrew Cates


