 Global| Nov 15 2005
PPI Up Another 0.7%, Core Prices Fell
by:Tom Moeller
|in:Economy in Brief
Summary
The overall Producer Price Index rose another 0.7% last month on top of the 1.9% September spike. The latest by far exceeded Consensus expectations for no change in prices. The strength last month was led by a 12.3% (50.4% y/y) rise [...]
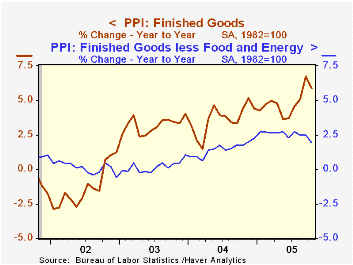
The overall Producer Price Index rose another 0.7% last month on top of the 1.9% September spike. The latest by far exceeded Consensus expectations for no change in prices.
The strength last month was led by a 12.3% (50.4% y/y) rise in home heating oil prices and a 12.7% (38.9% y/y) jump in natural gas which more than offset the 3.3% (+40.3% y/y) decline in gasoline.
Price inflation at the so called "core" level nevertheless eased a bit last month as a 0.3% decline in prices less food & energy reversed all of the prior month's gain. Consensus expectations for a 0.2% increase.
Core finished consumer goods prices fell 0.2% (+2.0% y/y). Durable goods prices dropped 0.9% (+0.2% y/y) led by a 3.0% (-2.1% y/y) decline in passenger car prices as well as weakness in prices for home electronics (-2.0% y/y), carpets (+6.1% y/y) and home appliances (+1.7% y/y). Core consumer nondurable goods prices rose 0.2% (3.5% y/y) for the second consecutive month.
"Spillover" effects from the past strength in oil prices continued to be evident at the earlier stages of processing. Intermediate goods prices jumped 3.0% on top of the 2.5% September surge while core intermediate goods prices repeated their 1.2% spike of the prior month.
Crude energy prices gained 12.4% (69.4% y/y) as natural gas prices soared an unadjusted 20.3% (120.4% y/y). The gain lifted overall crude prices 6.7% though core crude prices reversed some of their September strength with a 1.2% decline. During the last thirty years "core" crude prices have been a fair indicator of industrial sector activity with a 48% correlation between the six month change in core crude prices and the change in factory sector industrial production.
| Producer Price Index | Oct | Sept | Y/Y | 2004 | 2003 | 2002 |
|---|---|---|---|---|---|---|
| Finished Goods | 0.7% | 1.9% | 5.9% | 3.6% | 3.2% | -1.3% |
| Core | -0.3% | 0.3% | 2.0% | 1.5% | 0.2% | 0.1% |
| Intermediate Goods | 3.0% | 2.5% | 10.5% | 6.6% | 4.6% | -1.5% |
| Core | 1.2% | 1.2% | 4.3% | 5.7% | 2.0% | -0.5% |
| Crude Goods | 6.7% | 10.2% | 31.5% | 17.5% | 25.1% | -10.6% |
| Core | -1.2% | 5.3% | 0.9% | 26.6% | 12.4% | 3.8% |

Tom Moeller
AuthorMore in Author Profile »Prior to joining Haver Analytics in 2000, Mr. Moeller worked as the Economist at Chancellor Capital Management from 1985 to 1999. There, he developed comprehensive economic forecasts and interpreted economic data for equity and fixed income portfolio managers. Also at Chancellor, Mr. Moeller worked as an equity analyst and was responsible for researching and rating companies in the economically sensitive automobile and housing industries for investment in Chancellor’s equity portfolio. Prior to joining Chancellor, Mr. Moeller was an Economist at Citibank from 1979 to 1984. He also analyzed pricing behavior in the metals industry for the Council on Wage and Price Stability in Washington, D.C. In 1999, Mr. Moeller received the award for most accurate forecast from the Forecasters' Club of New York. From 1990 to 1992 he was President of the New York Association for Business Economists. Mr. Moeller earned an M.B.A. in Finance from Fordham University, where he graduated in 1987. He holds a Bachelor of Arts in Economics from George Washington University.
More Economy in Brief

 Global| Feb 05 2026
Charts of the Week: Balanced Policy, Resilient Data and AI Narratives
by:Andrew Cates

