 Global| May 16 2006
PPI Up Expected 0.9%, Core Tame
by:Tom Moeller
|in:Economy in Brief
Summary
The April finished goods producer price index jumped 0.9%. That was the largest gain since a 1.4% spike last September but it about matched Consensus expectations had been for a 0.8% rise. Less food & energy the (core) PPI increased [...]
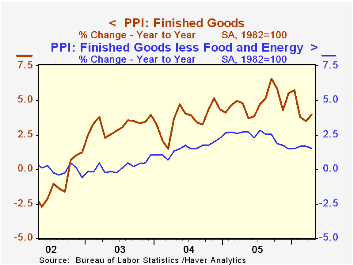
The April finished goods producer price index jumped 0.9%. That was the largest gain since a 1.4% spike last September but it about matched Consensus expectations had been for a 0.8% rise.
Less food & energy the (core) PPI increased 0.1% last month and fell short of expectations for a 0.2% rise. Durable consumer goods prices were unchanged (0.3% y/y) following two months of 0.1% increase and core consumer nondurable prices rose 0.1% (2.6% y/y) following three months of stronger gain. Apparel prices continued lower. Prices of all finished consumer goods less food & energy rose 0.1% (1.6% y/y).
Capital equipment prices rose 0.2% (1.4% y/y) after two months of 0.1% gains.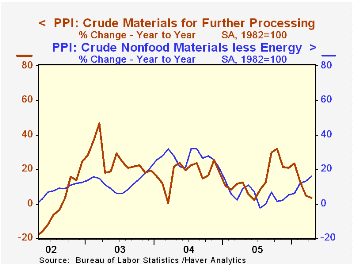
Finished energy prices jumped 4.0% (17.8% y/y) as gasoline prices increased 12.3% (33.9% y/y) and home heating oil rose 13.7% (27.6% y/y). A 3.0% decline in natural gas prices (+12.4% y/y) was the third consecutive monthly drop.
Intermediate goods prices jumped 0.9% on higher energy prices which rose 2.8% (18.4% y/y). Core intermediate prices increased 0.4%.
Crude goods prices regained about half of the prior month's decline with a 1.2% increase. Energy prices rose 1.3% higher crude oil prices were offset by lower prices for natural gas. Core crude prices, however, were notably strong and posted a 4.7% gain and are up 8.4% year to date. Copper base scrap (59.1% y/y), aluminum scrap (28.7% y/y) and iron & steel scrap (8.7% y/y) all continued strong. During the last thirty years "core" crude prices have been a fair indicator of industrial sector activity with a 48% correlation between the six month change in core crude prices and the change in factory sector industrial production.
| Producer Price Index | April | Mar | Y/Y | 2005 | 2004 | 2003 |
|---|---|---|---|---|---|---|
| Finished Goods | 0.9% | 0.5% | 4.0% | 4.9% | 3.6% | 3.2% |
| Core | 0.1% | 0.1% | 1.5% | 2.4% | 1.5% | 0.2% |
| Intermediate Goods | 0.9% | -0.1% | 7.3% | 8.0% | 6.6% | 4.7% |
| Core | 0.4% | 0.1% | 4.9% | 5.5% | 5.7% | 2.0% |
| Crude Goods | 1.2% | -2.7% | 3.3% | 14.6% | 17.5% | 25.1% |
| Core | 4.7% | 0.8% | 16.0% | 4.8% | 26.5% | 12.4% |

Tom Moeller
AuthorMore in Author Profile »Prior to joining Haver Analytics in 2000, Mr. Moeller worked as the Economist at Chancellor Capital Management from 1985 to 1999. There, he developed comprehensive economic forecasts and interpreted economic data for equity and fixed income portfolio managers. Also at Chancellor, Mr. Moeller worked as an equity analyst and was responsible for researching and rating companies in the economically sensitive automobile and housing industries for investment in Chancellor’s equity portfolio. Prior to joining Chancellor, Mr. Moeller was an Economist at Citibank from 1979 to 1984. He also analyzed pricing behavior in the metals industry for the Council on Wage and Price Stability in Washington, D.C. In 1999, Mr. Moeller received the award for most accurate forecast from the Forecasters' Club of New York. From 1990 to 1992 he was President of the New York Association for Business Economists. Mr. Moeller earned an M.B.A. in Finance from Fordham University, where he graduated in 1987. He holds a Bachelor of Arts in Economics from George Washington University.
More Economy in Brief

 Global| Feb 05 2026
Charts of the Week: Balanced Policy, Resilient Data and AI Narratives
by:Andrew Cates

