 Global| Sep 02 2003
Pressure on China's Currency
Summary
After devaluing its currency 50% from 5.8 to 8.7 yuan to the dollar on December 1993 Chinas yuan appreciated slightly to approximately 8.2 yuan to the dollar by mid 1995. (The Yuan is the internationally traded currency. The renminbi [...]
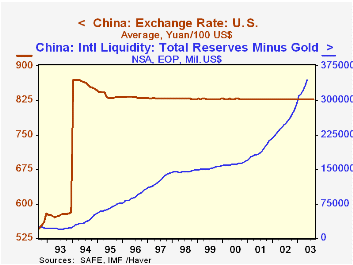
After devaluing its currency 50% from 5.8 to 8.7 yuan to the dollar on December 1993 China’s yuan appreciated slightly to approximately 8.2 yuan to the dollar by mid 1995. (The Yuan is the internationally traded currency. The renminbi is its local counterpart.) It has since remained essentially unchanged, holding steady even in late 1997 and early 1998 when massive devaluations took place among other countries in the Pacific Rim, notably Indonesia, Thailand and Korea.
In recent years, China’s trade surplus and inflows of foreign investment have climbed with the result that its holdings of foreign exchange have increased more than 15 fold from $22, billion to $345 billion from the end of 1993 to the present. The increase in reserves tends to add to the money supply and is causing concern over potential inflationary pressures. In addition, the U. S., in particular, is pressuring China to float the Yuan. China’s trade surplus with the U.S. rose to $9.6 billion in March of this year and exceeded that of Japan for the first time.
The Chinese authorities recognize that exchange rate flexibility is inevitable as China increases its participation in world economic fora, such as the WTO (World Trade Organization), but they are reluctant to act quickly. They do appear, however, to be taking steps to increase the demand for dollars within China. The limit on dollars that Chinese citizens are allowed to take abroad was recently raised to $5000 from $2000. In addition consideration is being given to allowing insurance and some other companies to invest in U.S. bonds and to allowing exporters to keep a greater proportion of their dollar earnings.
| China | Billions of US Dollars Year over Year Change||||||||
|---|---|---|---|---|---|---|---|---|
| 2003 | 2002 | 2001 | 2000 | 2003 | 2002 | 2001 | 2000 | |
| Reserves (May) | 344,979 | 241,896 | 182,044 | 160,071 | 42.6% | 32.9% | 13.3% | 6.9% |
| Exports to the U.S. (March) | 9,803 | 4,749 | 4,395 | 3,992 | 106.4% | 8.1% | 10.1% | 29.4% |
| Direct Investment (Year) | n.a. | 49,308 | 44,241 | 38,399 | n.a. | 11.5% | 15.2% | -0.9% |
More Economy in Brief

 Global| Feb 05 2026
Charts of the Week: Balanced Policy, Resilient Data and AI Narratives
by:Andrew Cates

