 Global| Nov 22 2005
Revisions and Additions to German National Accounts Data for Q3
Summary
Final results for Germany's third quarter Gross Domestic Product were released today. In addition to revisions of the preliminary estimates of total GDP released a week ago, details of the composition of both the expenditure and [...]

Final results for Germany's third quarter Gross Domestic Product were released today. In addition to revisions of the preliminary estimates of total GDP released a week ago, details of the composition of both the expenditure and income sides of the national accounts are given. Estimates of the contribution to growth of the various sectors are also available and are shown in the table below for the first three quarters of 2005.
In the first chart we show the contribution of domestic demand and net exports to total GDP growth. Over the past five years changes in both net exports and domestic demand have been erratic and have tended to offset one another. In the last quarter, a positive contribution of 1.30 percentage points from net exports was offset by a negative contribution of 0.60 percentage points from domestic demand.
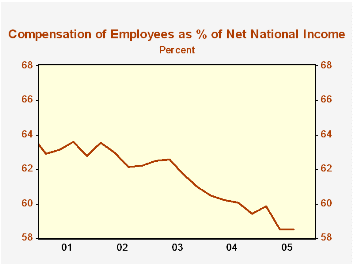
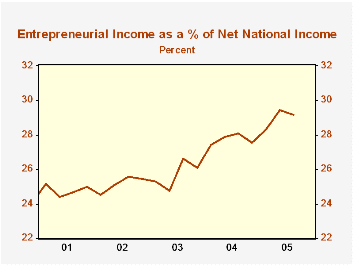
According to data on the income side of the National Accounts there has been a marked change in the distribution of income in Germany over the past five years. The share of compensation of employees in net national income has been declining over this period, as shown in the second chart. From 62.9% of net national income in the first quarter of 2001, employee compensation has declined to 58.5& in the third quarter of 2005. The counterpart to the decline in the share of compensation has been the rise in the share of entrepreneurial income (shown in the third chart) from 25.1% in the first quarter of 2001 to 29.1% in the third quarter of 2005. The changing distribution of income may account for a part of the sluggish trend in private consumption over this period.
| Germany Contribution to Growth | Q3 05 % Pts | Q2 05 % Pts | Q1 05 % Pts |
|---|---|---|---|
| Growth of Gross Domestic Product | 0.70 | 0.0 | 0.10 |
| Net Exports | 1.30 | -1.00 | -0.50 |
| Domestic Demand | -0.60 | 0.90 | -0.40 |
| Consumption | -0.10 | 0.30 | -0.30 |
| Private | -0.10 | 0.00 | -0.60 |
| Government | 0.00 | 0.30 | 0.20 |
| Gross Fixed Investment | 0.20 | 0.10 | 0.10 |
| Inventories | -0.70 | 0.50 | -0.20 |
| Share of Net National Income | Q1 01 % | Q3 05 % | |
| Compensation of Employees | 62.9 | 59.5 | |
| Entrepreneurial Income | 25.1 | 29.1 |


