 Global| May 09 2006
Small Business Optimism Recovered
by:Tom Moeller
|in:Economy in Brief
Summary
Small business optimism in April recovered most of the prior month's decline with a 2.1% rise, according to the National Federation of Independent Business (NFIB). During the last ten years there has been a 70% correlation between the [...]
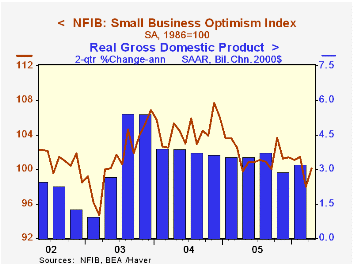
Small business optimism in April recovered most of the prior month's decline with a 2.1% rise, according to the National Federation of Independent Business (NFIB).
During the last ten years there has been a 70% correlation between the level of the NFIB index and the two quarter change in real GDP.
Respondents expecting higher real sales in six months recovered about half of a precipitous March decline though expectations that the economy would improve remained negative for the second month. 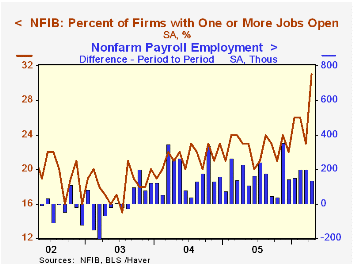
The percentage of firms with one or more job openings improved sharply to the highest level since early 2001. During the last ten years there has been a 72% correlation between the NFIB percentage and the y/y change in nonfarm payrolls.
The percent planning to raise capital expenditures recovered half of the sharp March decline..The percentage of firms planning to raise average selling prices rose to the highest level since January and the percentage of firms actually raising prices rose as well. During the last ten years there has been a 60% correlation between the change in the producer price index and the level of the NFIB price index.
About 24 million businesses exist in the United States. Small business creates 80% of all new jobs in America.
| Nat'l Federation of Independent Business | April | Mar | Y/Y | 2005 | 2004 | 2003 |
|---|---|---|---|---|---|---|
| Small Business Optimism Index (1986=100) | 100.1 | 98.0 | 0.3% | 101.6 | 104.6 | 101.3 |
by Tom Moeller May 9, 2006
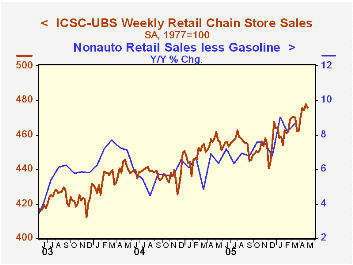
Chain store sales slipped 0.4% last week, according to the International Council of Shopping Centers (ICSC)-UBS survey. The decline, however, followed several heady gains during April. Therefore, the opening level of May sales was 0.3% above the April average which rose 1.6% from March.
During the last ten years there has been a 47% correlation between the y/y change in chain store sales and the change in nonauto retail sales less gasoline.
The chain store sales leading indicator was unchanged (-1.0% y/y) during the last week of April. The month's average fell 0.8% from March which rose 0.3% versus February.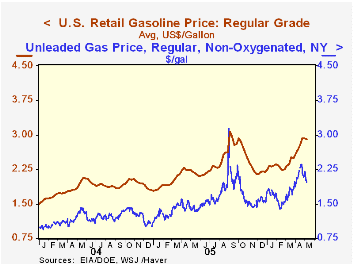
The ICSC-UBS retail chain-store sales index is constructed using the same-store sales (stores open for one year) reported by 78 stores of seven retailers: Dayton Hudson, Federated, Kmart, May, J.C. Penney, Sears and Wal-Mart.
Retail gasoline prices slipped one penny last week to $2.91 per gallon, reversing the modest rise during the prior week. Yesterday, the recent decline in spot market gasoline prices continued and for unleaded regular, the NY price was off 13 cents from last week's average.
Bringing Down Gas and Oil Prices from the American Enterprise Institute is available here.
| ICSC-UBS (SA, 1977=100) | 05/06/06 | 04/29/06 | Y/Y | 2005 | 2004 | 2003 |
|---|---|---|---|---|---|---|
| Total Weekly Chain Store Sales | 475.9 | 477.7 | 3.1% | 3.6% | 4.7% | 2.9% |
by Louise Curley May 9, 2006
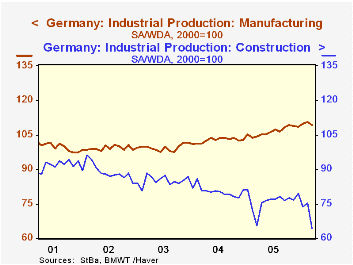
March industrial production in Germany fell 2.4% in contrast to expectations of a small rise. The decline was the biggest monthly fall since June, 2000. Excluding construction, which declined by 14.5%, production still declined by 1.7%. Manufacturing output declined 1.3% with declines in capital goods production of 2.5%, in consumer goods, 1.0%, in energy, 5.3% and in intermediate goods, 0.5%. Production in Manufacturing and Construction are compared in the first chart.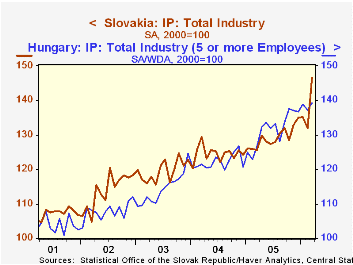
The set back in production is not necessarily a sign that the moderate upturn in the German economy is in danger. The month of March was unseasonally very cold, a fact that could account for some of the sharp drop in construction activity. In addition there was a brief work stoppage in late March when 700,000 workers in North Rhine-Westphalia were called off the job in connection with the 2006 wage negotiations of IG Metall (Germany's union of some 3.4 million engineering workers). The union's initial demand was for a 5% wage increase, but the workers in North Rhine-Westphalia subsequently settled for a 3% wage increase. Expectations are that this settlement will be accepted by the six remaining regional chapters of the union and become a model for a nationwide agreement.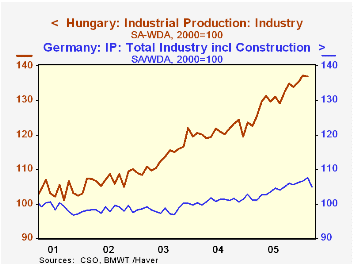
Industrial production in Eastern Europe continues to show strength--Slovakia, in particular, with an 11% rise in production from February to March. Production in Hungary was up a more modest 1.5% in the same period. Industrial production in the two countries is shown in the second chart. The year-over-year gains were 16.6% in Slovakia and 10.1% in Hungary. (These data are found in the Haver data base EMERGECW.) The data for Hungary are preliminary and are based on the output of firms with five or more employees.
As an example of the different trends in industrial production in Western and Eastern Europe, production in Germany and Hungary are shown in the third chart.
| Industrial Production (2000=100) | Mar 06 | Feb 06 | Mar 05 | M/M % | Y/Y % | 2005 | 2004 | 2003 |
|---|---|---|---|---|---|---|---|---|
| Germany | ||||||||
| Total | 105.0 | 107.6 | 101.1 | -2.42 | 3.86 | 103.8 | 100.8 | 98.4 |
| Total ex Construction | 108.4 | 110.3 | 104.1 | -1.72 | 4.13 | 106.1 | 102.5 | 99.5 |
| Construction | 64.3 | 75.2 | 65.5 | -14.49 | -1.83 | 76.1 | 80.4 | 85.1 |
| Manufacturing | 109.2 | 110.2 | 104.3 | -1.27 | 4.70 | 106.6 | 102.7 | 99.4 |
| Hungary | 139.36 | 137.3 | 126.6 | 1.50 | 10.08 | 131.5 | 122.11 | 114.42 |
| Slovakia | 146.5 | 132.0 | 125.6 | 10.98 | 16.64 | 129.1 | 124.6 | 119.6 |

Tom Moeller
AuthorMore in Author Profile »Prior to joining Haver Analytics in 2000, Mr. Moeller worked as the Economist at Chancellor Capital Management from 1985 to 1999. There, he developed comprehensive economic forecasts and interpreted economic data for equity and fixed income portfolio managers. Also at Chancellor, Mr. Moeller worked as an equity analyst and was responsible for researching and rating companies in the economically sensitive automobile and housing industries for investment in Chancellor’s equity portfolio. Prior to joining Chancellor, Mr. Moeller was an Economist at Citibank from 1979 to 1984. He also analyzed pricing behavior in the metals industry for the Council on Wage and Price Stability in Washington, D.C. In 1999, Mr. Moeller received the award for most accurate forecast from the Forecasters' Club of New York. From 1990 to 1992 he was President of the New York Association for Business Economists. Mr. Moeller earned an M.B.A. in Finance from Fordham University, where he graduated in 1987. He holds a Bachelor of Arts in Economics from George Washington University.
More Economy in Brief

 Global| Feb 05 2026
Charts of the Week: Balanced Policy, Resilient Data and AI Narratives
by:Andrew Cates

