 Global| Dec 06 2005
Sweden and Norway Report Good Third Quarter Growth
Summary
Two more Nordic countries--Sweden and Norway--reported third quarter GDP data today. With Denmark, having reported last week, only Finland in the Nordic area remains to be heard from. So far growth in the area has been stronger than [...]

Two more Nordic countries--Sweden and Norway--reported third quarter GDP data today. With Denmark, having reported last week, only Finland in the Nordic area remains to be heard from. So far growth in the area has been stronger than that of the Euro Zone. In both countries private consumption and investment were strong.
The official releases of the two countries highlight different measures of growth. Sweden's Statistical Bureau highlights the year-to-year change in the seasonally unadjusted data while Norway's Statistical Bureau highlights the quarter-to-quarter change in the seasonally adjusted data. According to the Swedish method, Sweden's GDP rose 3.43% in the third quarter. The comparable figure for Norway would be 3.11%. Norway reports growth separately for its Mainland activities and for its North Sea petroleum activities and ocean transport. Mainland GDP rose 3.13% in the third quarter while the petroleum and ocean transport rose 3.01%. According to the Norwegian method. Sweden's GDP rose 0.95% in the third quarter while that of Norway rose 0.80%. (Norway's Mainland GDP rose 0.83% and the petroleum and related activities rose 0.69%.) Thus, when allowance is made for the various definitions of growth the two countries show roughly similar rates of growth in the third quarter.
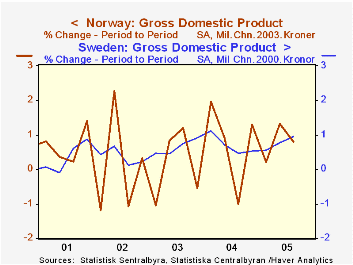
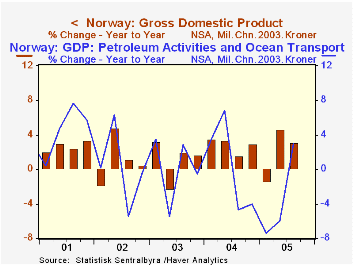
Over time, however, Norwegian growth has tended to be more volatile than that of Sweden as can be seen in the first chart that shows the quarter-to-quarter percent changes in the seasonally adjusted GDP for both countries. The volatility in the Norwegian data is due in large part to the volatility of the petroleum activities. The second chart shows the year-to-year changes in Norway's Mainland GDP and it petroleum related GDP activities.
| Q3 05 % | Q2 05 % | Q1 05 % | 2004 % | 2003 % | 2002 % | |
|---|---|---|---|---|---|---|
| Sweden GDP | ||||||
| Q/Q change in SA data | 0.95 | 0.77 | 0.55 | 3.74 | 1.69 | 2.00 |
| Y/Y change in NSA data | 3.43 | 3.19 | 0.86 | |||
| Norway GDP | ||||||
| Q/Q change in SA data | 0.80 | 1.32 | 0.20 | 2.81 | 1.13 | 1.11 |
| Y/Y change in NSA data | 3.11 | 4.65 | -1.36 | |||
| Norway Mainland GDP | ||||||
| Q/Q change in SA data | 0.83 | 0.85 | 0.48 | 3.43 | 1.41 | 1.41 |
| Y/Y change in NSA data | 3.13 | 7.42 | 0.24 | |||
| Norway Petroleum Activities and Ocean Transport | ||||||
| Q/Q change in SA data | 0.69 | 3.36 | -0.99 | 0.35 | -0.00 | 0.10 |
| Y/Y change in NSA data | 3.01 | -5.98 | -7.42 |


