 Global| Dec 01 2008
The Recent Rise of the U.S. Dollar
Summary
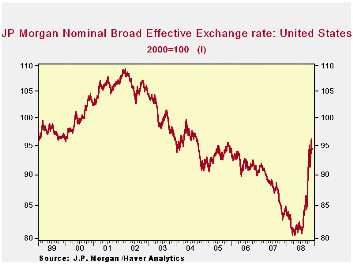
J.P. Morgan's broad effective exchange rate for the U. S. hasstaged a dramatic reversal in its long decline since 2001 by appreciating 17% from July 15 to last Friday. The first chart shows the daily values of this index over that [...]


J.P. Morgan's broad effective exchange rate for the U. S. hasstaged a dramatic reversal in its long decline since 2001 by appreciating 17% from July 15 to last Friday. The first chart shows the daily values of this index over that past ten years.
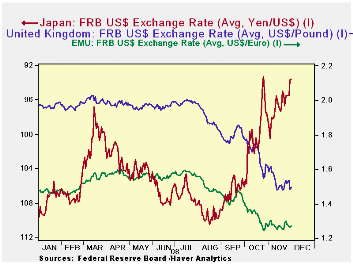
It is hard to find a country whose exchange rate has not depreciated against the U. S. dollar in the period from July 15 to November 28, 2008.The one significant exception is Japan where the currency has appreciated by almost 10% against the dollar. Both the Euro and the British pound have experienced depreciations of 20% and 23% respectively. These currencies are shown in the second chart.
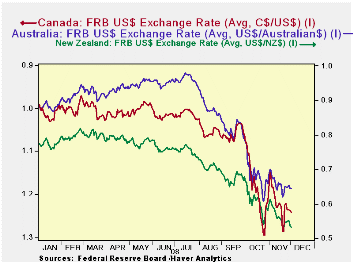
The Canadian dollar has seen a 22% decline in its currency relative to the dollar, New Zealand a 29% decline and Australia, a 33% decline since July 15 of the year, as shown in the third chart.


| EXCHANGE RATES | July 15, 08 | Nov 28, 08 | Depreciation | Appreciation |
|---|---|---|---|---|
| J.P. Morgan Broad Effective Exchange Rate (2000=100) | 80.7 | 94.3 | -- | 16.7% |
| Australian Dollar (US$/AUS$) | .9797 | .6546 | -33.2% | -- |
| New Zealand Dollar (US$/NZ$) | .7721 | .5500 | -28.8% | -- |
| Canadian Dollar (C$/US$) | 1.0015 | 1.286 | -22.1% | -- |
| United Kingdom Pound (US$/UKP) | 2.0036 | 1.5348 | -23.4% | -- |
| Euro (US$/Euro) | 1.5914 | 1.2694 | -20.2% | -- |
| Japanese Yen (Yen/US$) | 104.64 | 95.46 | -- | 9.62% |
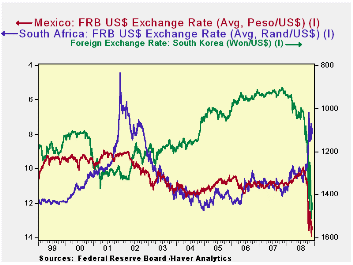
| Mexico (Peso/ US$) | 10.32 | 13.39 | -22.9% | -- |
| South Korea (Won/US$) | 1006.3 | 1468.0 | -31.4% | -- |
| South Africa (Rand/US$) | 7.64 | 10.1 | -24.4% | -- |
More Economy in Brief
 Global| Feb 05 2026
Charts of the Week: Balanced Policy, Resilient Data and AI Narratives
by:Andrew Cates


