Global| May 11 2005
Trade Deficit Eases in UK, Surplus Increases in Canada, but Energy May Be Starting to Restrain Demand for Non- [...]
Summary
The surprising reduction in the US trade deficit for March begs for comparison with trade data reported today by other major countries. We've highlighted here the role of energy in two oil-producing nations, the UK and Canada, along [...]
The surprising reduction in the US trade deficit for March begs for comparison with trade data reported today by other major countries. We've highlighted here the role of energy in two oil-producing nations, the UK and Canada, along with the US. In the US, the petroleum deficit continued to widen, but modestly, while the non-petroleum deficit fell sharply in the month, as described by Tom Moeller in the Haver.com homepage commentary for today.
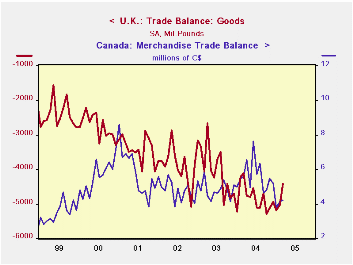
In the UK, the overall trade deficit decreased to £4.4 billion in March from £5.1 billion in February. The non-oil deficit also decreased, but just slightly, reflecting a 1.8% rise in non-oil exports after two successive monthly declines. The oil surplus in the UK is marginal, and in some months, oil even runs a small deficit. The non-oil deficit had widened fairly consistently from 1997 through the middle of last year and has since begun to diminish gradually, as import growth has tended to slow.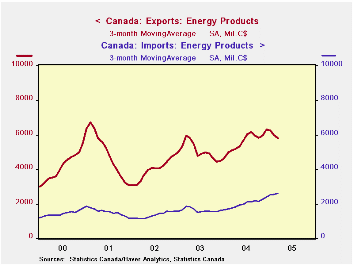
Canada's trade balance was C$4.235 billion in March, up from C$4.155 billion in February. The energy surplus is drifting down a little, with the March value, C$3.4 billion, off from the 2004 average of C$3.7 billion. Exports of energy products have flattened in the last six month, but energy imports are trending upward, as seen in the second graph. The surplus in non-energy trade has fallen more distinctly with a modest slowing of those exports.
In both the US and the UK, non-energy imports have recently turned down. For the US, this is just a one-month development and could easily be reversed, but in the UK, March was the third month. Possibly the weight of energy on these economies is starting to restrain other purchasing from abroad. This is an important development to monitor.
| Millions of Local Currency, Seasonally Adjusted |
Mar 2005 | Feb 2005 | Mar 2004 | Monthly Average|||
|---|---|---|---|---|---|---|
| 2004 | 2003 | 2002 | ||||
| UK: Balance on Goods | -4,412 | -5,037 | -4,108 | -4,829 | -3,972 | -3,890 |
| Balance on Oil | 384 | 44 | 193 | 163 | 344 | 478 |
| Balance ex Oil | -4,796 | -5,081 | -4,519 | -4,992 | -4,316 | -4,368 |
| Canada: Balance on Goods | 4,235 | 4,155 | 5,584 | 5,602 | 4,848 | 4,768 |
| Balance on Energy | 3,386 | 3,053 | 3,164 | 3,693 | 3,406 | 2,738 |
| Balance ex Energy | 849 | 102 | 2,420 | 1,909 | 1,442 | 2,030 |
| US: Balance on Goods | -57,171 | -63,538 | -50,026 | -54,234 | -44,362 | -39,022 |
| Balance on Petroleum | -16,992 | -16,343 | -13,013 | -13,653 | -10,034 | -7,764 |
| Balance ex Petroleum | -41,179 | -47,195 | -37,013 | -40,582 | -34,329 | -31,258 |
Carol Stone, CBE
AuthorMore in Author Profile »Carol Stone, CBE came to Haver Analytics in 2003 following more than 35 years as a financial market economist at major Wall Street financial institutions, most especially Merrill Lynch and Nomura Securities. She had broad experience in analysis and forecasting of flow-of-funds accounts, the federal budget and Federal Reserve operations. At Nomura Securities, among other duties, she developed various indicator forecasting tools and edited a daily global publication produced in London and New York for readers in Tokyo. At Haver Analytics, Carol was a member of the Research Department, aiding database managers with research and documentation efforts, as well as posting commentary on select economic reports. In addition, she conducted Ways-of-the-World, a blog on economic issues for an Episcopal-Church-affiliated website, The Geranium Farm. During her career, Carol served as an officer of the Money Marketeers and the Downtown Economists Club. She had a PhD from NYU's Stern School of Business. She lived in Brooklyn, New York, and had a weekend home on Long Island.
More Economy in Brief
 Global| Feb 05 2026
Charts of the Week: Balanced Policy, Resilient Data and AI Narratives
by:Andrew Cates