 Global| Oct 15 2010
U.S. Budget Deficit Decreases in FY10: "Only" 8.9% of GDP
Summary
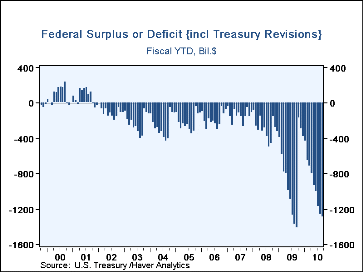
The U.S. Government's budget deficit decreased in fiscal year 2010, ended September 30, to $1.294 trillion from $1.417 trillion in FY09, according to the annual release of fiscal year budget results published today by the U.S. [...]
 The U.S. Government's budget deficit decreased in fiscal year 2010, ended September
30, to $1.294 trillion from $1.417 trillion in FY09, according to the annual release of fiscal year
budget results published today by the U.S. Treasury and the Office of
Management and Budget. The latest year's shortfall amounted to 8.9% of
GDP, a relative improvement from the previous 10.0%.
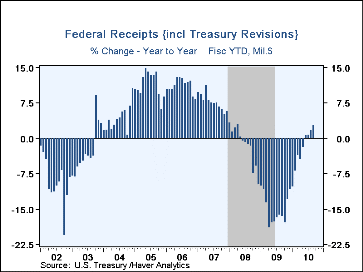
Receipts grew by 2.7% in the fiscal year, following FY09's drop by one-sixth (16.6%). Of the major receipt items, however, only corporate income taxes increased, these by 38.5%. Individual income taxes edged lower by 1.8% and social insurance and retirement receipts were down 2.9%. Clearly, the aftermath of recession and continuing lack of employment growth hampered the two wage-and-salary-linked tax categories, while the rebound in corporate profits boosted the tax receipts from that source, which had shrunk the previous year by more than half.
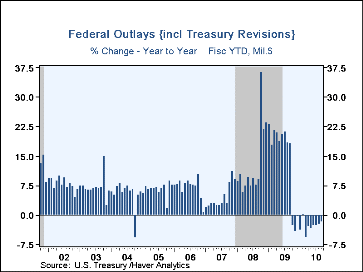
Reported outlays decreased a bit, by 1.8%, from $3.520 trillion in FY09 to $3.456 trillion in FY10. They had jumped by 18.2% in FY09. The major reductions actually came from an influx of "offsetting receipts" to financial aid programs, especially including repayments of some TARP funds and inflows to FDIC and the National Credit Union Administration. In contrast, the major spending programs, including the income-providing and health-financing functions we show in the table below, all continued to expand.
In our accompanying graphs, the notation in the title "{incl Treasury Revisions}" indicates that fiscal year-to-date data incorporate occasional revisions by Treasury accountants. Thus, these may differ from the sum of previously reported individual months' data over the same periods.
Haver's basic data on Federal Government outlay and receipts and summary presentations of the Budget from both OMB and CBO are contained in USECON. Considerable detail is given in the separate GOVFIN database.
| US Government Finance | FY 2010 | FY 2009 | FY 2008 | FY 2007 |
|---|---|---|---|---|
| Budget Balance | -$1,294.1B | -$1,417.1B | -$454.8B | -$161.5B |
| as a percent of GDP | -8.9% | -10.0% | -3.2% | -1.2% |
| Net Revenues (Y/Y % Change) | 2.7% | -16.6% | -1.7% | 6.7% |
| Individual Income Taxes | -1.8 | -20.1 | -1.5 | 11.5 |
| Corporate Income Taxes | 38.5 | -54.6 | -17.8 | 4.6 |
| Social Insurance Taxes | -2.9 | -1.0 | 3.5 | 3.8 |
| Net Outlays (Y/Y % Change) | -1.8 | 18.2 | 9.1 | 2.8 |
| Nat'l Defense | 5.0 | 7.6 | 11.8 | 4.1 |
| Health | 10.4 | 19.1 | 5.4 | 5.5 |
| Medicare | 5.0 | 10.1 | 4.1 | 13.8 |
| Income Security | 16.9 | 24.9 | 16.8 | 3.5 |
| Social Security | 3.5 | 10.7 | 5.3 | 6.9 |
| Interest | 3.3 | -24.5 | 6.3 | 5.0 |
Carol Stone, CBE
AuthorMore in Author Profile »Carol Stone, CBE came to Haver Analytics in 2003 following more than 35 years as a financial market economist at major Wall Street financial institutions, most especially Merrill Lynch and Nomura Securities. She has broad experience in analysis and forecasting of flow-of-funds accounts, the federal budget and Federal Reserve operations. At Nomura Securites, among other duties, she developed various indicator forecasting tools and edited a daily global publication produced in London and New York for readers in Tokyo. At Haver Analytics, Carol is a member of the Research Department, aiding database managers with research and documentation efforts, as well as posting commentary on select economic reports. In addition, she conducts Ways-of-the-World, a blog on economic issues for an Episcopal-Church-affiliated website, The Geranium Farm. During her career, Carol served as an officer of the Money Marketeers and the Downtown Economists Club. She has a PhD from NYU's Stern School of Business. She lives in Brooklyn, New York, and has a weekend home on Long Island.


