 Global| May 15 2019
U.S. Business Inventories Unchanged While Sales Surged in March
by:Sandy Batten
|in:Economy in Brief
Summary
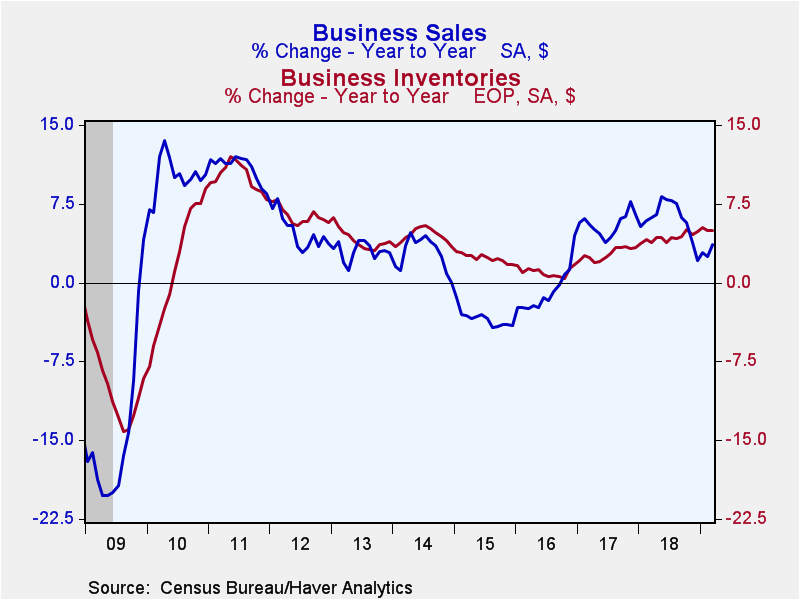
Total business inventories were unchanged (+5.0% y/y) in March after rising 0.3% m/m in February and jumping 0.9% m/m in January. In contrast, total business sales surged 1.6% m/m (3.7% y/y) in March versus a 0.2% m/m increase in [...]
Total business inventories were unchanged (+5.0% y/y) in March after rising 0.3% m/m in February and jumping 0.9% m/m in January. In contrast, total business sales surged 1.6% m/m (3.7% y/y) in March versus a 0.2% m/m increase in February. As a result of the jump in sales with unchanged inventories, the inventory-to-sales (I/S) ratio fell to 1.37 in March after having stood at 1.39 for three consecutive months. Business inventory swings can have a meaningful impact on GDP. Indeed, increases in inventories in the first quarter contributed 0.65%-point to the larger-than-expected 3.2% q/q saar increase in real GDP.
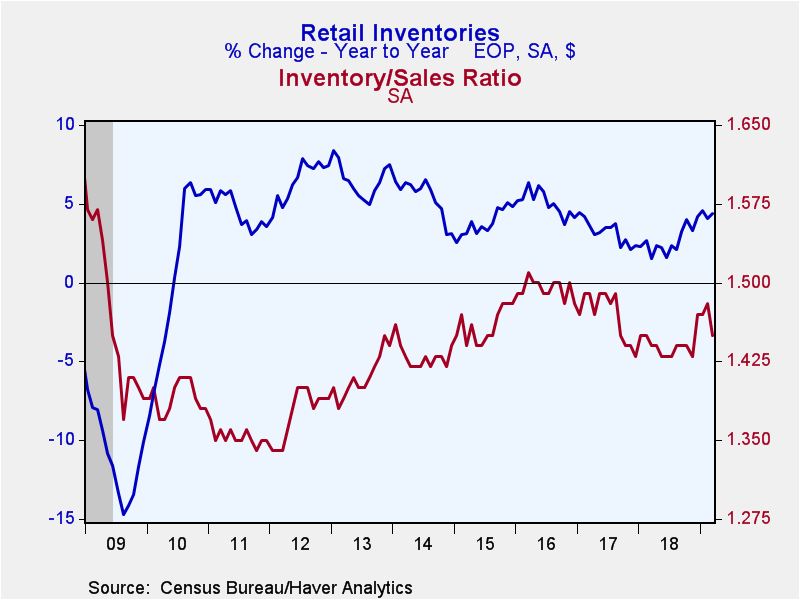
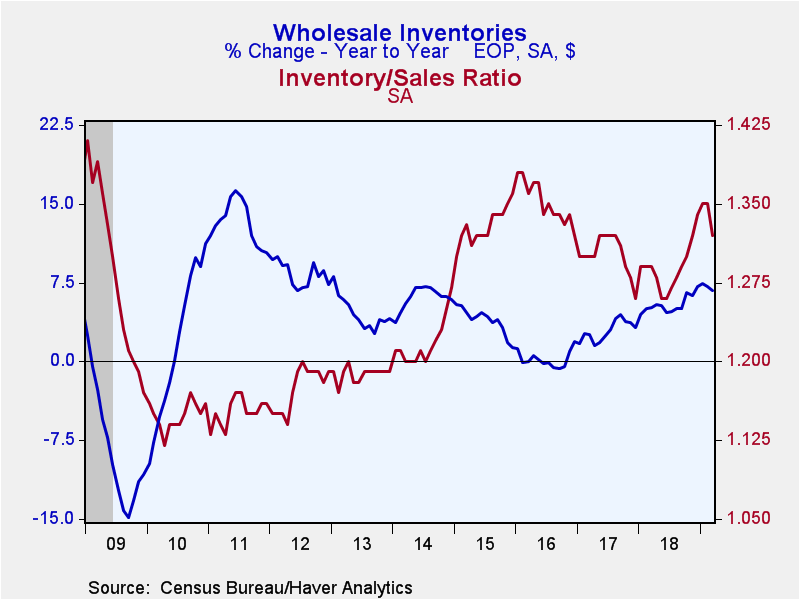
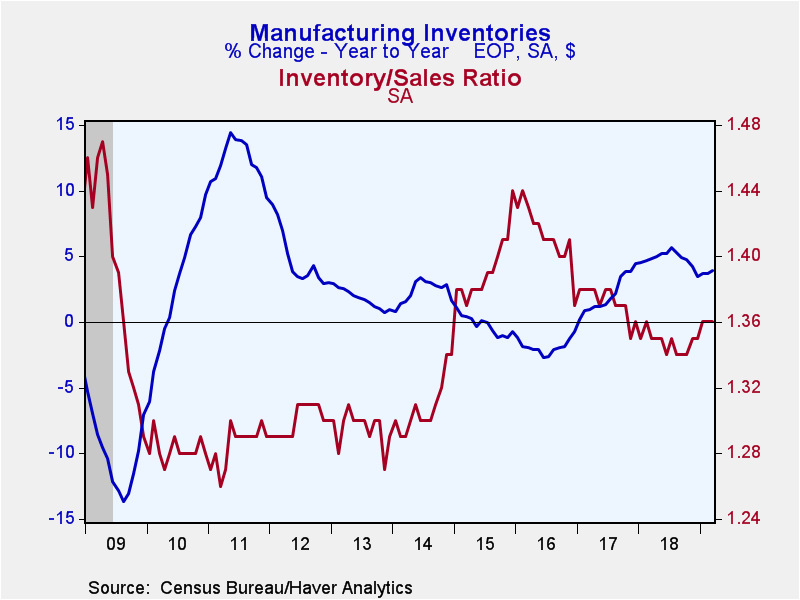
Retail inventories led the slowdown in inventories in March with retail stocks falling 0.3% m/m (+4.4% y/y) after a 0.2% m/m increase in February and a 0.8% m/m jump in January. Retail inventories excluding motor vehicles were unchanged in March (+2.6% y/y) with a 0.9% m/m decline in auto inventories accounting for the fall in retail inventories. Inventories at general merchandise stores slipped 0.2% m/m (+1.4% y/y) in March on top of a 0.3% m/m decline in February. Furniture and home furnishings inventories fell 1.0% m/m (+1.2% y/y) in March for their first decline in four months. Wholesale inventories edged down 0.1% m/m in March while manufacturing inventories rose 0.4% m/m.
Business sales increased 1.6% m/m (3.7% y/y) in March following a tepid 0.2% m/m gain in February. A 2.3% m/m (3.9% y/y) surge in wholesale sales in March led the rise in total sales. Additionally, retail sales jumped up 1.8% m/m (3.6% y/y) in March. (Note that this morning advance retail sales for April were reported to have fallen 0.2% m/m (+2.8% y/y).) Manufacturing sales rose a comparatively more modest 0.7% m/m (3.5% y/y) in March, but this was the second consecutive monthly increase after four consecutive monthly declines.
Inventory-to-sales ratios generally declined in March with sales up and inventories flat to down. The inventory-to-sales ratio in the retail sector slipped to 1.45 from 1.48. The ratio for wholesalers fell to 1.32 from 1.35, while the ratio for manufacturers was unchanged at 1.36.
After an extended period of time in which y/y sales growth outpaced y/y inventory growth, inventory growth has exceeded sales growth over the past five months. This could simply be inventories catching up to faster-than-expected sales growth but it could be the beginning of an inventory overhang that bears watching. Stay tuned for further installments.
The manufacturing and trade data are in Haver's USECON database.
| Manufacturing & Trade | Mar | Feb | Jan | Mar Y/Y | 2018 | 2017 | 2016 |
|---|---|---|---|---|---|---|---|
| Business Inventories (% chg) | 0.0 | 0.3 | 0.9 | 5.0 | 4.9 | 3.4 | 1.7 |
| Retail | -0.3 | 0.2 | 0.8 | 4.4 | 4.2 | 2.4 | 4.1 |
| Retail excl. Motor Vehicles | 0.0 | 0.4 | 0.7 | 2.6 | 1.2 | 2.2 | 1.9 |
| Merchant Wholesalers | -0.1 | 0.3 | 1.2 | 6.7 | 7.1 | 3.3 | 1.9 |
| Manufacturing | 0.4 | 0.4 | 0.5 | 3.9 | 3.5 | 4.5 | -0.7 |
| Business Sales (% chg) | |||||||
| Total | 1.6 | 0.2 | 0.3 | 3.7 | 6.1 | 5.6 | -0.8 |
| Retail | 1.8 | -0.4 | 0.8 | 3.6 | 4.7 | 5.0 | 2.5 |
| Retail excl. Motor Vehicles | 1.3 | -0.4 | 1.6 | 3.5 | 5.4 | 5.0 | 2.0 |
| Merchant Wholesalers | 2.3 | 0.3 | 0.5 | 3.9 | 6.6 | 6.7 | -1.3 |
| Manufacturing | 0.7 | 0.5 | -0.3 | 3.5 | 6.8 | 5.0 | -3.2 |
| I/S Ratio | |||||||
| Total | 1.37 | 1.39 | 1.39 | 1.36 | 1.36 | 1.38 | 1.42 |
| Retail | 1.45 | 1.48 | 1.47 | 1.44 | 1.44 | 1.47 | 1.49 |
| Retail excl. Motor Vehicles | 1.20 | 1.21 | 1.20 | 1.21 | 1.20 | 1.24 | 1.28 |
| Merchant Wholesalers | 1.32 | 1.35 | 1.35 | 1.29 | 1.29 | 1.30 | 1.35 |
| Manufacturing | 1.36 | 1.36 | 1.36 | 1.35 | 1.35 | 1.37 | 1.41 |
Sandy Batten
AuthorMore in Author Profile »Sandy Batten has more than 30 years of experience analyzing industrial economies and financial markets and a wide range of experience across the financial services sector, government, and academia. Before joining Haver Analytics, Sandy was a Vice President and Senior Economist at Citibank; Senior Credit Market Analyst at CDC Investment Management, Managing Director at Bear Stearns, and Executive Director at JPMorgan. In 2008, Sandy was named the most accurate US forecaster by the National Association for Business Economics. He is a member of the New York Forecasters Club, NABE, and the American Economic Association. Prior to his time in the financial services sector, Sandy was a Research Officer at the Federal Reserve Bank of St. Louis, Senior Staff Economist on the President’s Council of Economic Advisors, Deputy Assistant Secretary for Economic Policy at the US Treasury, and Economist at the International Monetary Fund. Sandy has taught economics at St. Louis University, Denison University, and Muskingun College. He has published numerous peer-reviewed articles in a wide range of academic publications. He has a B.A. in economics from the University of Richmond and a M.A. and Ph.D. in economics from The Ohio State University.
More Economy in Brief
 Global| Feb 05 2026
Charts of the Week: Balanced Policy, Resilient Data and AI Narratives
by:Andrew Cates


