 Global| Mar 01 2013
U.S. Construction Spending Down in January, Mainly in Utility Plants
Summary
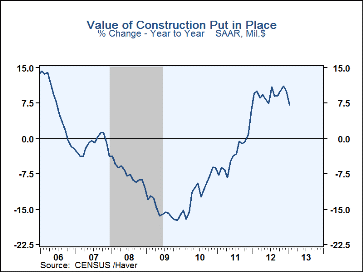
Construction put-in-place fell 2.1% in January (+7.1% y/y) after December's 1.1% increase. December was revised slightly from a 0.9% increase reported a month ago, but November received a boost from new data on electric power plant [...]
Construction put-in-place fell 2.1% in January (+7.1% y/y) after December's 1.1% increase. December was revised slightly from a 0.9% increase reported a month ago, but November received a boost from new data on electric power plant construction, which produced a 1.9% rise in total construction put-in-place, compared to just +0.1% shown in last month's report. Apparently, the November jump in power plant construction was then reflected in the January drop. In dollar terms, total construction fell $19.3 billion (SAAR) in January, including a $15.0 billion decrease in new private power construction. The January decline in the total contrasted to consensus expectations of a 0.4% increase, which would have been based in the old data for the previous months.
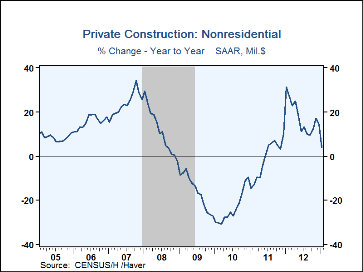
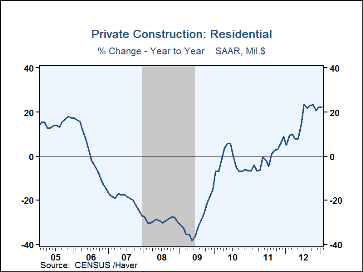
Private construction overall was down 2.6% in January (+12.2% y/y) after a 2.1% increase in December, marginally revised from 2.0% reported before. November, including that power plant category, was revised to +2.7% from +0.2%. The total for the nonresidential segment fell 5.1% in January (+4.0% y/y), following a 2.4% increase in December and 5.5% in November, the latter revised from -0.3%. Private residential construction was virtually unchanged in January (up 22.0% from a year ago), with December revised down to 1.7% from 2.2% and November revised modestly from +0.6% to -0.1%. Notably, the flat result in Janaury masked a shift in the mix, with new housing up 3.3%, mostly in single-family, and improvements falling 4.3%.
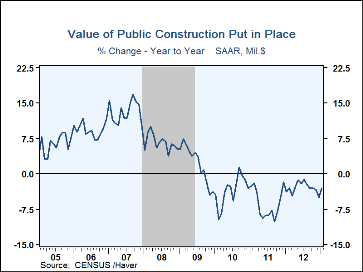
Public construction continued in a modestly declining trend, falling 1.0% in January (-3.0% y/y) with December also down 1.0%, revised from -1.4% reported last month; November was unchanged and also only marginally revised from -0.1% in the previous report. State and local construction, by far the larger segment, was down 1.0%, and federal government construction was off 1.3%.
The construction spending figures are in Haver's USECON database and the expectations figure is contained in the AS1REPNA database.
Carol Stone, CBE
AuthorMore in Author Profile »Carol Stone, CBE came to Haver Analytics in 2003 following more than 35 years as a financial market economist at major Wall Street financial institutions, most especially Merrill Lynch and Nomura Securities. She has broad experience in analysis and forecasting of flow-of-funds accounts, the federal budget and Federal Reserve operations. At Nomura Securites, among other duties, she developed various indicator forecasting tools and edited a daily global publication produced in London and New York for readers in Tokyo. At Haver Analytics, Carol is a member of the Research Department, aiding database managers with research and documentation efforts, as well as posting commentary on select economic reports. In addition, she conducts Ways-of-the-World, a blog on economic issues for an Episcopal-Church-affiliated website, The Geranium Farm. During her career, Carol served as an officer of the Money Marketeers and the Downtown Economists Club. She has a PhD from NYU's Stern School of Business. She lives in Brooklyn, New York, and has a weekend home on Long Island.


