 Global| Feb 02 2012
U.S. Construction Spending Recovers in December
Summary
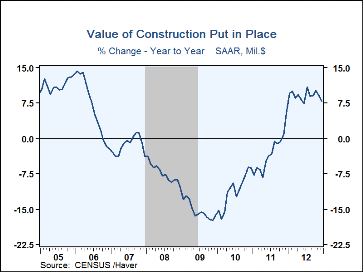
Construction put-in-place gained 0.9% in December after a minuscule 0.1% rise in November, when activity was restrained following Hurricane Sandy. The November amount was revised upward from a 0.3% fall reported before, and October [...]
Construction put-in-place gained 0.9% in December after a minuscule 0.1% rise in November, when activity was restrained following Hurricane Sandy. The November amount was revised upward from a 0.3% fall reported before, and October was revised markedly higher from 0.7% to 1.6% in this report. The December figure is modestly stronger than consensus forecasts of 0.7%.
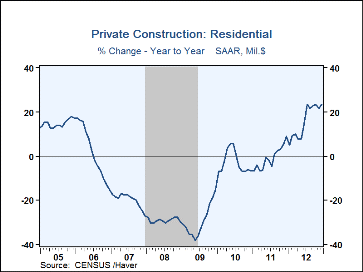
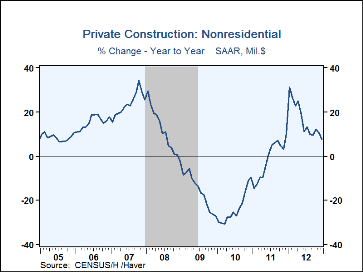
The rebound was entirely in private construction sectors. Private residential building went up 2.2% in December after a 0.6% rise in November. This put December a substantial 23.6% above the year earlier and put 2012 as a whole up 15.9% from 2011. And the strength here was in multi-family housing construction, with a 6.2% m/m surge after a 1.8% gain in November. Single-family building was hardly weak, though, with an 0.8% m/m gain in December, but this is extending a slower trend that had November’s rise at 1.5% and October at 3.8%. Recent firming of single-family starts may support higher amounts in coming months, however. Private nonresidential construction rebounded by 1.8% in December after falling 0.3% in November. It was 7.6% above December 2011 and the year 2012 was up 16.0% from 2011. In December, lodging, offices, education, power and manufacturing categories all contributed to the upturn.
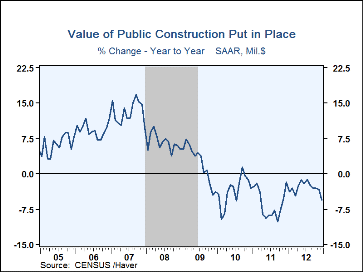
Public construction weakened in December. It fell 1.4%, after a 0.1% decrease in November. The latest month was 5.6% below the year-earlier month and 2012 was down 3.0% from 2011. State and local construction, by far the larger segment, is continuing to ratchet lower, with a 1.7% decline in December after a modest 0.4% increase in November. December was down 4.3% from a year ago and the year was off 1.5% from 2011. Federal spending gained in December by 1.3%, but earlier drops put it down 16.5% from the year before and 2012 down 15.8% from 2011.
The construction spending figures are in Haver's USECON database and the expectations figure is contained in the AS1REPNA database.
| Construction Put in Place (%) | ||||||||
|---|---|---|---|---|---|---|---|---|
| Dec | Nov | Oct | Y/Y | 2012 | 2011 | 2010 | ||
| Total | 0.9 | 0.1 | 1.6 | 7.8 | 9.1 | -3.1 | -11.2 | |
| Private | 2.0 | 0.2 | 2.5 | 15.0 | 16.0 | -1.1 | -15.2 | |
| Residential | 2.2 | 0.6 | 3.2 | 23.6 | 15.9 | -1.0 | -2.9 | |
| Nonresidential | 1.8 | -0.3 | 1.7 | 7.6 | 16.0 | -1.3 | 24.0 | |
| Public | -1.4 | -0.1 | -0.2 | -5.6 | -3.0 | -6.4 | -3.6 | |
Carol Stone, CBE
AuthorMore in Author Profile »Carol Stone, CBE came to Haver Analytics in 2003 following more than 35 years as a financial market economist at major Wall Street financial institutions, most especially Merrill Lynch and Nomura Securities. She had broad experience in analysis and forecasting of flow-of-funds accounts, the federal budget and Federal Reserve operations. At Nomura Securities, among other duties, she developed various indicator forecasting tools and edited a daily global publication produced in London and New York for readers in Tokyo. At Haver Analytics, Carol was a member of the Research Department, aiding database managers with research and documentation efforts, as well as posting commentary on select economic reports. In addition, she conducted Ways-of-the-World, a blog on economic issues for an Episcopal-Church-affiliated website, The Geranium Farm. During her career, Carol served as an officer of the Money Marketeers and the Downtown Economists Club. She had a PhD from NYU's Stern School of Business. She lived in Brooklyn, New York, and had a weekend home on Long Island.


