 Global| Nov 01 2005
U.S. Construction Spending Rose Further
by:Tom Moeller
|in:Economy in Brief
Summary
The value of construction put in place matched Consensus expectations for the second month in a row and rose 0.5% in September following an upwardly revised 0.6% gain in August. Private building activity increased 0.6%. Residential [...]
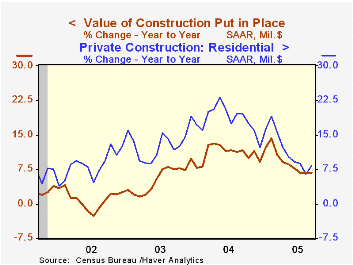
The value of construction put in place matched Consensus expectations for the second month in a row and rose 0.5% in September following an upwardly revised 0.6% gain in August.
Private building activity increased 0.6%. Residential building jumped 1.0% as new single family building surged 1.4% (10.5% y/y) though the value of residential improvements fell 0.2% (-1.0% y/y), the seventh consecutive monthly decline.
Nonresidential building activity fell 0.3% after a 2.1% spike in August due to less commercial sector spending where auto industry outlays fell 4.4% (+9.6% y/y). Office construction surged 3.8% (12.2% y/y) after upwardly revised, small gains in the prior three months.
Public construction spending fell slightly due to a 0.9% (+19.7% y/y) decline in construction activity on highways & streets, nearly one third of the value of public construction spending.
These more detailed categories represent the Census Bureau’s reclassification of construction activity into end-use groups. Finer detail is available for many of the categories; for instance, commercial construction is shown for Automotive sales and parking facilities, drugstores, building supply stores, and both commercial warehouses and mini-storage facilities. Note that start dates vary for some seasonally adjusted line items in 2000 and 2002 and that constant-dollar data are no longer computed.
| Construction Put-in-place | Sept | Aug | Y/Y | 2004 | 2003 | 2002 |
|---|---|---|---|---|---|---|
| Total | 0.5% | 0.6% | 6.8% | 10.9% | 5.4% | 1.0% |
| Private | 0.6% | 0.7% | 6.2% | 13.6% | 6.3% | -0.4% |
| Residential | 1.0% | 0.1% | 8.2% | 18.2% | 12.9% | 8.5% |
| Nonresidential | -0.3% | 2.1% | 1.4% | 3.9% | -5.4% | -13.0% |
| Public | -0.0% | 0.4% | 9.0% | 2.5% | 2.7% | 5.7% |

Tom Moeller
AuthorMore in Author Profile »Prior to joining Haver Analytics in 2000, Mr. Moeller worked as the Economist at Chancellor Capital Management from 1985 to 1999. There, he developed comprehensive economic forecasts and interpreted economic data for equity and fixed income portfolio managers. Also at Chancellor, Mr. Moeller worked as an equity analyst and was responsible for researching and rating companies in the economically sensitive automobile and housing industries for investment in Chancellor’s equity portfolio. Prior to joining Chancellor, Mr. Moeller was an Economist at Citibank from 1979 to 1984. He also analyzed pricing behavior in the metals industry for the Council on Wage and Price Stability in Washington, D.C. In 1999, Mr. Moeller received the award for most accurate forecast from the Forecasters' Club of New York. From 1990 to 1992 he was President of the New York Association for Business Economists. Mr. Moeller earned an M.B.A. in Finance from Fordham University, where he graduated in 1987. He holds a Bachelor of Arts in Economics from George Washington University.
More Economy in Brief

 Global| Feb 05 2026
Charts of the Week: Balanced Policy, Resilient Data and AI Narratives
by:Andrew Cates

