 Global| May 01 2020
U.S. Construction Unexpectedly Rises in March
Summary
• Construction spending increased 0.9% in March with downwards revisions to previous months. • Residential activity grew 2.3% while nonresidential edged down 0.1%. • Forward-looking indicators such as mortgage applications and state [...]
• Construction spending increased 0.9% in March with downwards revisions to previous months.
• Residential activity grew 2.3% while nonresidential edged down 0.1%.
• Forward-looking indicators such as mortgage applications and state and local government budget pressures suggest substantial weakness ahead.
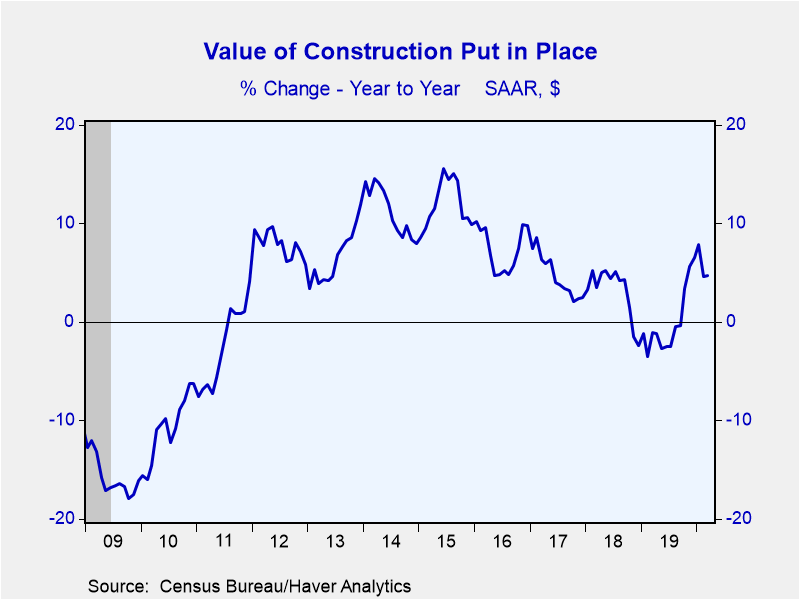
The value of construction put-in-place unexpectedly rose 0.9% in March (4.7% year-on-year). The Action Economics Forecast Survey expected a 3.6% drop. Both January and February were revised down to +2.6% and -2.5% respectively from +2.8% and -1.3%. In the first quarter GDP report released on Wednesday private construction spending (nonresidential + residential) added 0.46 percentage point to GDP growth. This data suggests little change from that advance estimate.
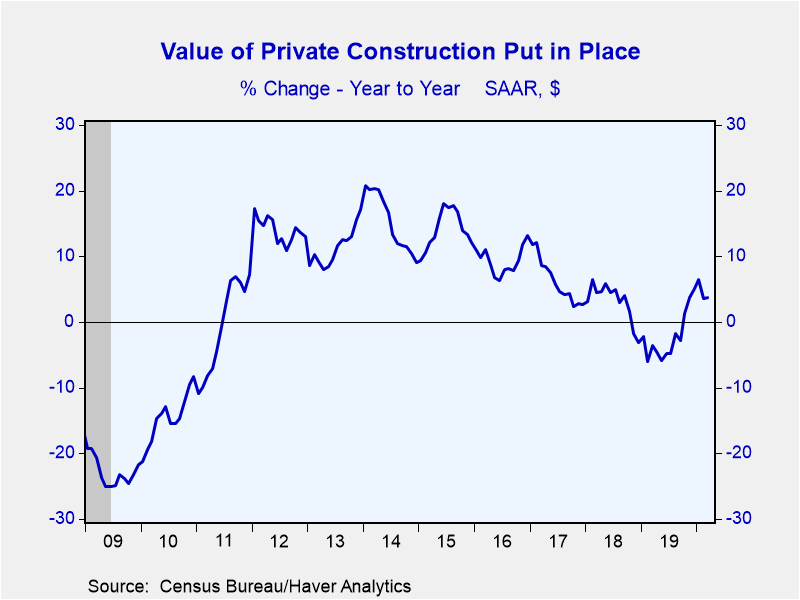
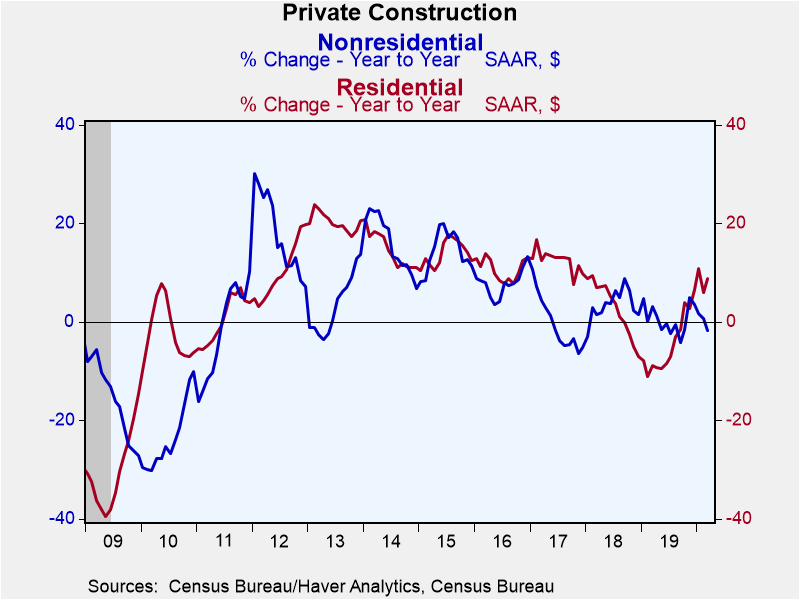
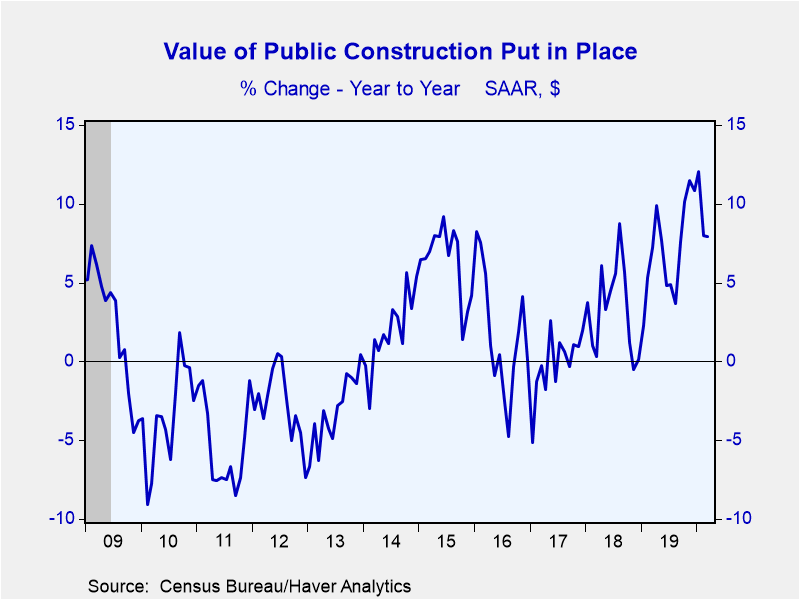
Private construction grew 0.7%% (3.7% y/y) in March while public rose 1.6% (7.9% y/y). Private residential construction increased 2.3% (8.8% y/y) buoyed by declining mortgage interest rates and healthy economic fundamentals until COVID related shutdowns, as well as warmer-than-normal weather. U.S. population-weighted heating was 98 degree-days below normal in March. Unfortunately, the over 30% y/y drop in the Mortgage Bankers Association index of loan applications for home purchase in April, suggest substantial weakness in housing activity going forward.
Nonresidential private construction declined 1.3% in March (-1.8% y/y) with the four largest sectors -- power, commercial, manufacturing, and office all down. Nonresidential public construction, which makes up 98% of public construction, grew 1.6% (+7.9% y/y), with road building up 4.6% (5.5% y/y) and school spending decreasing 0.3% (+4.9% y/y). If not offset by federal government support, the drop in state and local government revenues resulting from the COVID related collapse in economic activity will lead to substantial weakness in public construction.
The construction spending figures, some of which date back to 1946, as well as and US Population-Weighted Heating and Cooling Days can be found in Haver's USECON database. Mortgage interest rates and loan applications from the Mortgage Bankers Association are in the SURVEYW database and the expectations reading is in the AS1REPNA database.
| Construction Put in Place (SA, %) | Mar | Feb | Jan | Mar Y/Y | 2019 | 2018 | 2017 |
|---|---|---|---|---|---|---|---|
| Total | 0.9 | -2.5 | 2.6 | 4.7 | 0.0 | 3.3 | 4.5 |
| Private | 0.7 | -3.1 | 2.5 | 3.7 | -2.2 | 3.2 | 6.0 |
| Residential | 2.3 | -4.8 | 3.3 | 8.8 | -4.5 | 2.8 | 12.4 |
| Nonresidential | -1.3 | -1.2 | 1.6 | -1.8 | 0.5 | 3.7 | -0.7 |
| Public | 1.6 | -0.6 | 3.1 | 7.9 | 6.9 | 3.6 | -0.1 |
Gerald D. Cohen
AuthorMore in Author Profile »Gerald Cohen provides strategic vision and leadership of the translational economic research and policy initiatives at the Kenan Institute of Private Enterprise.
He has worked in both the public and private sectors focusing on the intersection between financial markets and economic fundamentals. He was a Senior Economist at Haver Analytics from January 2019 to February 2021. During the Obama Administration Gerald was Deputy Assistant Secretary for Macroeconomic Analysis at the U.S. Department of Treasury where he helped formulate and evaluate the impact of policy proposals on the U.S. economy. Prior to Treasury, he co-managed a global macro fund at Ziff Brothers Investments.
Gerald holds a bachelor’s of science from the Massachusetts Institute of Technology and a Ph.D. in Economics from Harvard University and is a contributing author to 30-Second Money as well as a co-author of Political Cycles and the Macroeconomy.
More Economy in Brief
 Global| Feb 05 2026
Charts of the Week: Balanced Policy, Resilient Data and AI Narratives
by:Andrew Cates


