 Global| Mar 18 2010
U.S. Current Account Deficit Widens Modestly; Flows of Goods, Services and Capital Show Signs of Recovery
Summary
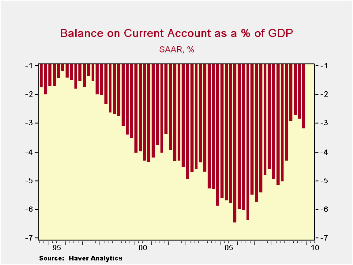
The U.S. current account deficit widened for a second quarter in Q4 to $115.6 billion from $102.3 in Q3. The result was a bit narrower, though than consensus expectations, which called for $118.5 billion. As a percentage of GDP, the [...]

The U.S. current account deficit widened for a second quarter
in Q4 to $115.6 billion from $102.3 in Q3. The result was a bit
narrower, though than consensus expectations, which called for $118.5
billion. As a percentage of GDP, the deficit was 3.2%, compared with
2.9% in Q3. For 2009 as a whole, the deficit totaled $419.9 billion,
much smaller than the $706.1 billion in 2008, and the smallest annual
figure since 2001. The year's ratio to GDP was 2.9% and that was the
smallest since 2.4% in 1998.
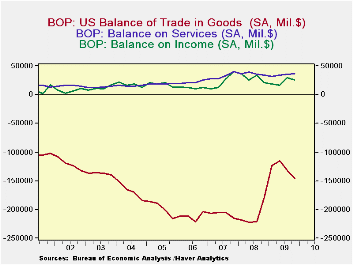
The balance on goods was $145.5 billion in Q4, larger than the
$132.1 billion in Q3. Both exports and imports had a second consecutive
quarter of increases, with imports, at 9.3%, somewhat more than export,
8.8% [large as these are, they are quarter-to-quarter changes, not
annual rates]. This contrasts with the aggregates for all of 2009,
which showed a bigger drop in imports, 26.2%, than in exports, at
18.1%. The balance on services hovered in a narrow range, coming at
$36.5 billion for Q4, compared with $35.7 billion in Q3 and an average
of $35.3 billion over the last eight quarters. Exports of services
gained for a third successive quarter and imports for a second. Among
exports, freight transportation and "other" private services seem to be
leading a recovery. There is little distinctive or sustained change
among import categories; foreign travel turned up in Q3, but then edged
back, and freight transportation increased modestly in both Q3 and Q4.
The balance on income turned down a bit in Q4, but at $25.1 billion and
$29.1 billion in Q3, it is well ahead of the first half of 2009, which
showed $16.6 billion in Q2 and $18.2 billion in Q1. Direct investment
income, both receipts and payments, contributed to an upturn in income
flows as economies in the US and abroad come out of recession.
Unilateral transfers sagged somewhat in Q4, coming in at $31.8 billion,
down from $35.0 and $33.3 billion in Q3 and Q2, respectively. For the
year, however, they totaled $130.2 billion, up from $128.4 billion in
2008 and a record for a single year. Government grants and pension
payments were larger in the year; private remittances were a bit
smaller than in 2008, but were still the second largest annual amount
ever.
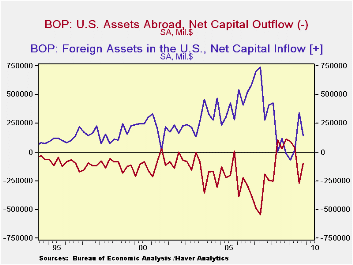
Financial flows showed somewhat irregular movements. In Q3 and Q4, there were net outflows of US funds as ownership of assets abroad increased. In Q3 this was a substantial $269.2 billion, and in Q4, "just" $99.1 billion. The Q3 amount included securities purchases, bank lending and the receipt of $47.7 billion in an allocation of special drawing rights (SDRs) from the IMF, a world-wide move intended to bolster world trade. For all of 2009, US private assets abroad increased by a total of $727.0 billion, a sharp turn-around from the liquidation of assets abroad of $534.4 billion in 2008. All US assets abroad increased by $237.5 billion for 2009, a very different result from the basically flat pattern in 2008.
Foreigners resumed significant purchases of assets in the US during the second half of 2009, amounting to $343.4 billion in Q3 and $144.8 billion in Q4. Foreign official investors were sizable buyers of US Treasury securities throughout the year, and private investors picked up their direct investment in the second half; while this latter came at a slower pace than 2006 through 2008, it did mark an upturn from quite sluggish amounts in the first half of 2009. These financial flows thus indicate some hesitant recovery following the recent dramatic contractions in world financial markets and the world economy, evident in the last graph by the retreat of both lines toward zero.


| US Balance of Payments SA | 4Q '09 | 3Q '09 | 2Q '09 | Year Ago | 2009 | 2008 | 2007 |
|---|---|---|---|---|---|---|---|
| Current Account Balance ($ Bil.) | -115.6 | -102.3 | -97.7 | -154.9 | -419.9 | -706.1 | -726.6 |
| Deficit % of GDP | 3.2 | 2.9 | 2.8 | 4.3 | 2.9 | 4.9 | 5.2 |
| Balance on Goods ($ Bil.) | -145.5 | -132.1 | -115.5 | -178.8 | -517.0 | -840.3 | -831.0 |
| Exports | 8.8% | 7.2% | -1.3% | -1.3% | -18.1% | 12.2% | 12.1% |
| Imports | 9.3% | 9.5% | -3.2% | -7.9% | -26.2% | 7.5% | 5.7% |
| Balance on Services ($ Bil.) | 36.5 | 35.7 | 34.4 | 34.3 | 138.4 | 144.3 | 129.6 |
| Exports | 2.0% | 3.0% | 2.0% | -1.4% | -7.4% | 8.9% | 15.8% |
| Imports | 1.9% | 2.7% | -0.2% | -4.1% | -8.5% | 8.0% | 7.5% |
| Balance on Income ($ Bil.) | 25.1 | 29.1 | 16.6 | 21.1 | 89.0 | 118.2 | 90.8 |
| Unilateral Transfers ($ Bil.) | -31.8 | -35.0 | -33.3 | -31.5 | -130.2 | -128.4 | -116.0 |
Carol Stone, CBE
AuthorMore in Author Profile »Carol Stone, CBE came to Haver Analytics in 2003 following more than 35 years as a financial market economist at major Wall Street financial institutions, most especially Merrill Lynch and Nomura Securities. She had broad experience in analysis and forecasting of flow-of-funds accounts, the federal budget and Federal Reserve operations. At Nomura Securities, among other duties, she developed various indicator forecasting tools and edited a daily global publication produced in London and New York for readers in Tokyo. At Haver Analytics, Carol was a member of the Research Department, aiding database managers with research and documentation efforts, as well as posting commentary on select economic reports. In addition, she conducted Ways-of-the-World, a blog on economic issues for an Episcopal-Church-affiliated website, The Geranium Farm. During her career, Carol served as an officer of the Money Marketeers and the Downtown Economists Club. She had a PhD from NYU's Stern School of Business. She lived in Brooklyn, New York, and had a weekend home on Long Island.
More Economy in Brief
 Global| Feb 05 2026
Charts of the Week: Balanced Policy, Resilient Data and AI Narratives
by:Andrew Cates


