 Global| Apr 30 2019
U.S. Employment Cost Index Increases Steadily
by:Tom Moeller
|in:Economy in Brief
Summary
The employment cost index (ECI) for civilian workers rose 0.7% in Q1'19 following a 0.7% Q4'18 gain. The riser matched expectations in the Action Economics Forecast Survey. The increase left y/y compensation growth at 2.9%, up from [...]
The employment cost index (ECI) for civilian workers rose 0.7% in Q1'19 following a 0.7% Q4'18 gain. The riser matched expectations in the Action Economics Forecast Survey. The increase left y/y compensation growth at 2.9%, up from its low of 1.7% y/y ten years ago. Civilian workers include those in private industry and state & local government, but not federal government employees.
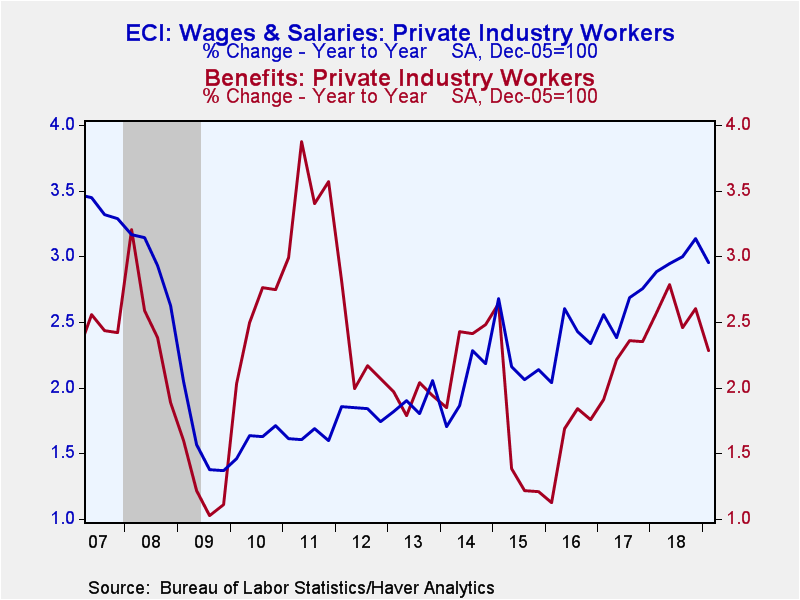
Wage and salaries rose 0.7% (2.8% y/y) following a 0.6% rise while benefits for civilian workers improved a steady 0.7% (2.7% y/y).
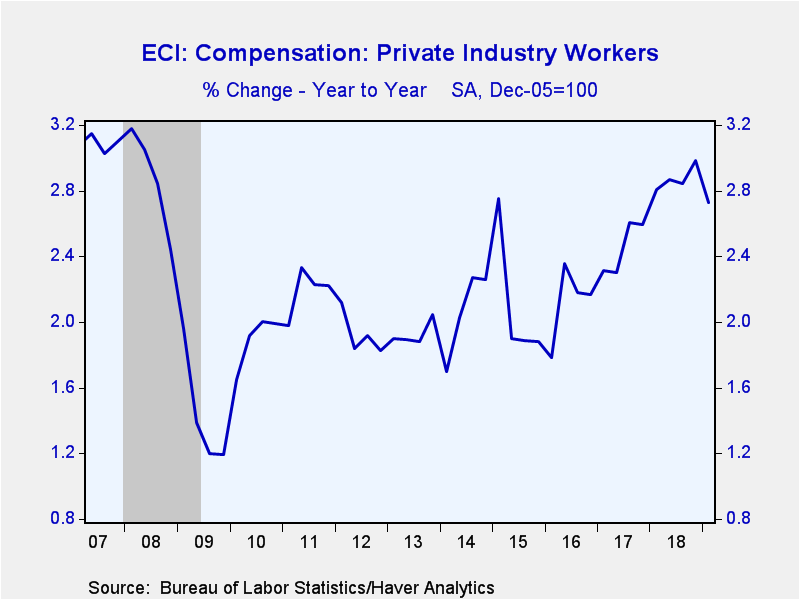
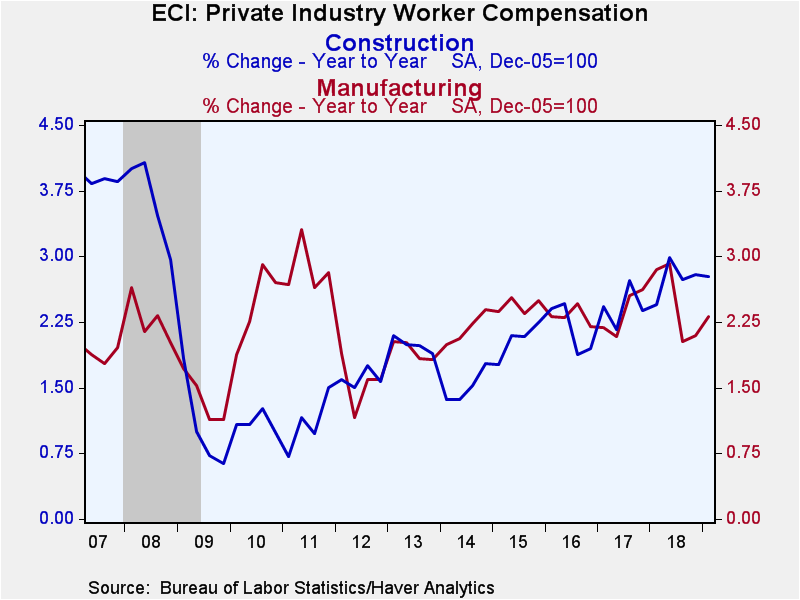
Employment cost gains in private industry improved to 0.7% last quarter after a 0.7% Q4 rise. Here again, however, the y/y rise of 2.7% was nearly the strongest growth in ten years. Compensation in goods producing industries rose an accelerated 0.8% (2.4% y/y) following a 0.6% rise. Factory sector compensation improved 0.9% (2.3% y/y) and earnings in the construction sector of 0.8% (2.8% y/y) compared to 0.6% in Q4. Compensation within the service sector increased 0.6% (2.8% y/y) as earnings in the leisure & hospitality sector rose a lessened 0.4%. The 3.3% y/y gain was increased from a low of 0.8% in early 2013. Education & health care compensation gained 0.4%, and the 2.5% y/y increase also was near a ten-year high. Professional & business services compensation improved 0.3% (2.3% y/y) after a 0.6% rise. Trade, transportation & utilities compensation rose a firmer 0.8% (3.2% y/y). Financial services compensation jumped 0.9% (2.7% y/y) after a 0.7% gain. Information sector earnings rose an accelerated 0.9% and 2.7% y/y. Sate & local government workers compensation improved 0.7%, and the 3.0% y/y gain increased from 1.6% in 2011. It as the strongest rate of gain since 2009.
Wage & salary gains within private industry held steady q/q at 0.7%, and the 3.0% y/y increase was improved from 1.6% averaged from 2009 to 2012. Goods-producing industry wages & salaries rose a steady 0.8%, but y/y growth accelerated to 2.9%. Factory sector wages & salaries rose a stronger 0.9% (2.9% y/y), matching the quickest quarterly increase since 2006. Construction wages & salaries rose a steady 0.7% (2.9% y/y). Service-producing industry wages & salaries increased a steady 0.7% (3.0% y/y). Annual wage & salary growth in leisure & hospitality backed off to 3.9%, but remained up from a low of 0.7% in 2011. In education & health services, wages & salaries rose 0.4% and a lessened 2.7% y/y. Professional & business services wages & salaries improved 0.4% and a lessened 2.6% y/y, and trade, transportation & utilities wages & salaries surged 1.0% (3.5% y/y). State & local government workers wages & salaries rose 0.6% and an accelerated 2.5% y/y, up from 0.9% in 2011.
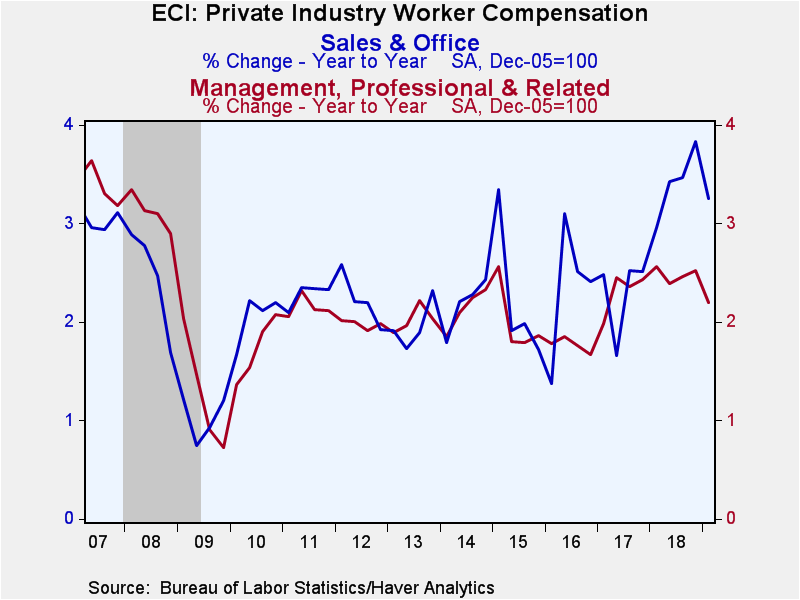
Private industry benefits rose a steady 0.5%, but the y/y gain eased to 2.4% as service-producing benefits rose 0.4% q/q and 2.6% y/y, up from 1.0% y/y in 2015. Sales & office worker benefits improved a greatly lessened 0.3% (2.9% y/y). Goods-producing benefits surged 0.9% (1.4% y/). Factory sector benefits jumped 0.9% after a 0.3% rise, but the y/y increase remained depressed at 1.0%. State & local government worker benefits strengthened a steady 1.0% q/q. The y/y increase of 3.7% was up from 2.1% in Q4'11.
The employment cost index figures are available in Haver's USECON database. Consensus estimates come from the Action Economics survey in Haver's AS1REPNA database. This quarter's release included annual seasonal adjustment revisions affecting the last five years.
Tom Moeller
AuthorMore in Author Profile »Prior to joining Haver Analytics in 2000, Mr. Moeller worked as the Economist at Chancellor Capital Management from 1985 to 1999. There, he developed comprehensive economic forecasts and interpreted economic data for equity and fixed income portfolio managers. Also at Chancellor, Mr. Moeller worked as an equity analyst and was responsible for researching and rating companies in the economically sensitive automobile and housing industries for investment in Chancellor’s equity portfolio. Prior to joining Chancellor, Mr. Moeller was an Economist at Citibank from 1979 to 1984. He also analyzed pricing behavior in the metals industry for the Council on Wage and Price Stability in Washington, D.C. In 1999, Mr. Moeller received the award for most accurate forecast from the Forecasters' Club of New York. From 1990 to 1992 he was President of the New York Association for Business Economists. Mr. Moeller earned an M.B.A. in Finance from Fordham University, where he graduated in 1987. He holds a Bachelor of Arts in Economics from George Washington University.
More Economy in Brief
 Global| Feb 05 2026
Charts of the Week: Balanced Policy, Resilient Data and AI Narratives
by:Andrew Cates


