 Global| Dec 04 2009
U.S. Factory Inventories Turn Up in October; Sizable Across-the-Board Revisions to September Factory Data
Summary
Factory inventories rose in October, by 0.4%, their first increase in 14 months. September's decline was revised from 1.0% to 1.3%, although this revision can actually be interpreted positively. Shipments in September were stronger [...]

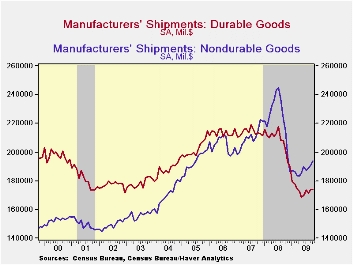
Factory inventories rose in October, by 0.4%, their first increase in 14 months. September's decline was revised from 1.0% to 1.3%, although this revision can actually be interpreted positively. Shipments in September were stronger than initially reported, gaining 1.3% instead of the 0.8% indicated a month ago. Thus, inventories decreased more then for the right reason: sales increased. Shipments continued upward in October by 0.8%. The resulting inventory/shipments ratio, which reached a 13-year high last winter of 1.46, continued to decline most recently, edging down from 1.35 in September to 1.34 in October.
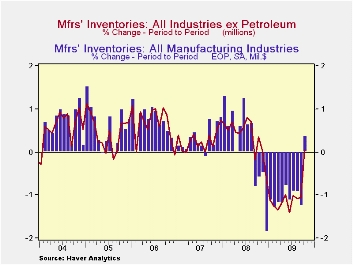
As our graph at left depicts, the uptick in October inventories was accounted for by the petroleum industry, as industries excluding that one had virtually flat stocks from September. This remains an obvious improvement, though, as the graph illustrates. Industries with increases in October include aircraft, various defense-related sectors and food; the petroleum sector saw a 6.1% rise in stocks, which we presume was heavily price-driven.
New orders continued to improve as well. Durable goods orders were down 0.6%, as Tom Moeller reported here a week ago. But revisions to September data were themselves increased in this latest report, so that total durable goods are now shown to have increased 2.2% compared to 2.0% a week ago, with the segment excluding transportation equipment up 2.1%, compared with 1.8%. Also, nondurable goods industries saw a 1.6% expansion in October, and their September results were revised notably higher, from 0.6% to 1.1%.
So the manufacturing sector is regaining its footing after a long contraction. These gains in orders, shipments and inventories, though still uneven among individual industries, suggest a broadening of an emerging economic recovery.
The Manufacturers' Shipments, Inventories and Orders (MSIO) data are available in Haver's USECON database.
| Factory Survey (NAICS, %) | October | September | August | Y/Y | 2008 | 2007 | 2006 |
|---|---|---|---|---|---|---|---|
| Inventories | 0.4 | -1.3 | -0.9 | -11.2 | 2.1 | 3.7 | 8.2 |
| Excluding Transportation | 0.2 | -1.0 | -0.4 | -13.2 | -0.6 | 2.7 | 7.9 |
| New Orders | 0.6 | 1.6 | -0.8 | -10.6 | 0.1 | 1.9 | 6.2 |
| Excluding Transportation | 0.5 | 1.5 | 0.3 | -10.2 | 3.1 | 1.2 | 7.4 |
| Shipments | 0.8 | 1.3 | -0.2 | -11.5 | 1.7 | 1.2 | 5.9 |
| Excluding Transportation | 1.5 | 0.6 | -0.1 | -11.8 | 3.7 | 1.5 | 6.7 |
| Unfilled Orders | -0.4 | -0.4 | -0.4 | -10.9 | 3.5 | 17.1 | 15.3 |
| Excluding Transportation | -0.2 | 0.6 | -0.1 | -12.6 | -1.0 | 8.2 | 16.0 |
Carol Stone, CBE
AuthorMore in Author Profile »Carol Stone, CBE came to Haver Analytics in 2003 following more than 35 years as a financial market economist at major Wall Street financial institutions, most especially Merrill Lynch and Nomura Securities. She had broad experience in analysis and forecasting of flow-of-funds accounts, the federal budget and Federal Reserve operations. At Nomura Securities, among other duties, she developed various indicator forecasting tools and edited a daily global publication produced in London and New York for readers in Tokyo. At Haver Analytics, Carol was a member of the Research Department, aiding database managers with research and documentation efforts, as well as posting commentary on select economic reports. In addition, she conducted Ways-of-the-World, a blog on economic issues for an Episcopal-Church-affiliated website, The Geranium Farm. During her career, Carol served as an officer of the Money Marketeers and the Downtown Economists Club. She had a PhD from NYU's Stern School of Business. She lived in Brooklyn, New York, and had a weekend home on Long Island.
More Economy in Brief
 Global| Feb 05 2026
Charts of the Week: Balanced Policy, Resilient Data and AI Narratives
by:Andrew Cates


