 Global| Dec 10 2009
U.S. Flow of Funds Indicates Expansion In Household Net-Worth To Highest In A Year
by:Tom Moeller
|in:Economy in Brief
Summary
The financial health of U.S. households continued to improve last quarter, as indicated by the Federal Reserve's latest flow-of-funds figures. Household net worth increased $2.7 trillion to $53.4 trillion after a downwardly revised [...]
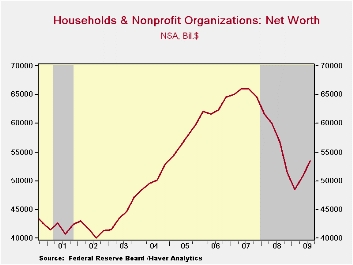
 The
financial health of U.S. households continued to improve last quarter,
as indicated by the Federal Reserve's latest flow-of-funds figures.
Household net worth increased $2.7 trillion to $53.4 trillion after a
downwardly revised $2.3 trillion 2Q increase. Financial asset holdings
improved by $2.4 trillion as the stock market moved higher after a $1.9
trillion 2Q rise. Lower interest rates raised the value of Treasury
security holdings by $168 billion and tangible asset values
rose by $294 billion following the $391 billion 2Q rise. These gains
were helped, finally, by an improved value of real estate holdings.
Despite the gains, however, the value of households' real estate
holdings remained 27.9% below the late-2006 peak.
The
financial health of U.S. households continued to improve last quarter,
as indicated by the Federal Reserve's latest flow-of-funds figures.
Household net worth increased $2.7 trillion to $53.4 trillion after a
downwardly revised $2.3 trillion 2Q increase. Financial asset holdings
improved by $2.4 trillion as the stock market moved higher after a $1.9
trillion 2Q rise. Lower interest rates raised the value of Treasury
security holdings by $168 billion and tangible asset values
rose by $294 billion following the $391 billion 2Q rise. These gains
were helped, finally, by an improved value of real estate holdings.
Despite the gains, however, the value of households' real estate
holdings remained 27.9% below the late-2006 peak.
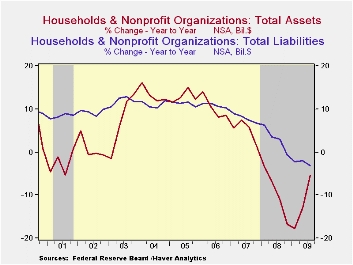
 Household
financial positions also improved due to the reduction of liabilities,
though that was small when compared to the rise in assets. Total
liabilities fell $12.0 billion. While the decline was the fifth in the
last six quarters, it paled versus recent $30-to-$300 quarterly
reductions. Mortgage debt reduction was the largest, down for the sixth
straight quarter, but consumer credit started to grow again along with
bank loans.
Household
financial positions also improved due to the reduction of liabilities,
though that was small when compared to the rise in assets. Total
liabilities fell $12.0 billion. While the decline was the fifth in the
last six quarters, it paled versus recent $30-to-$300 quarterly
reductions. Mortgage debt reduction was the largest, down for the sixth
straight quarter, but consumer credit started to grow again along with
bank loans.
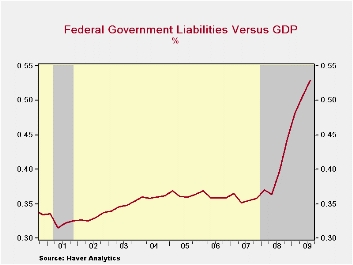 The Federal Government has shared in none of the balance
sheet improvement. The government's debt outstanding rose by nearly
one-third during last quarter versus 3Q '08 to $7.5 trillion as
spending rose and tax revenues sagged. The Federal Government's debt
outstanding rose to 52.9% of GDP. Elsewhere, there's been a strong
aversion to credit market liabilities with y/y declines posted by the
household and the noncorporate business sectors. Deleveraging in the
financial sector also has been impressive. The 5.2% y/y decline in
liabilities dropped the level to its lowest in a year.
End of Year
The Federal Government has shared in none of the balance
sheet improvement. The government's debt outstanding rose by nearly
one-third during last quarter versus 3Q '08 to $7.5 trillion as
spending rose and tax revenues sagged. The Federal Government's debt
outstanding rose to 52.9% of GDP. Elsewhere, there's been a strong
aversion to credit market liabilities with y/y declines posted by the
household and the noncorporate business sectors. Deleveraging in the
financial sector also has been impressive. The 5.2% y/y decline in
liabilities dropped the level to its lowest in a year.
End of Year
| Flow of Funds (Y/Y % Chg.) | % of Total Outstanding | 3Q '09 | 2Q '09 | End of Year | ||
|---|---|---|---|---|---|---|
| 2008 | 2007 | 2006 | ||||
| Total Credit Market Debt Outstanding | -- | 1.1 | 2.9 | 5.0 | 10.4 | 9.8 |
| Federal Government | 13.6% | 30.1 | 35.9 | 24.2 | 4.9 | 3.9 |
| Households | 25.9% | -1.8 | -1.2 | 0.3 | 6.7 | 10.0 |
| Nonfinancial Corporate Business | 13.8% | 1.8 | 2.8 | 5.1 | 13.2 | 8.4 |
| Nonfarm, Noncorporate Business | 6.9% | -5.3 | -1.7 | 5.5 | 14.2 | 14.7 |
| Financial Sectors | 31.3% | -5.2 | -1.0 | 5.5 | 13.4 | 9.9 |
| Trillions of $ | ||||||
| Net Worth: Households & Nonprofit Organizations | -- | $53.423 | $50.757 | $51,379 | $64.507 | $64.520 |
| Tangible Assets: Households | -- | $23.069 | $22.775 | $23.891 | $28.036 | $29.735 |
| Financial Assets: Households | -- | $44.415 | $42.055 | $41.706 | $50.788 | $48.192 |
| Total Liabilities: Households | -- | $14.061 | $14.073 | $14.218 | $14.318 | $13.408 |

Tom Moeller
AuthorMore in Author Profile »Prior to joining Haver Analytics in 2000, Mr. Moeller worked as the Economist at Chancellor Capital Management from 1985 to 1999. There, he developed comprehensive economic forecasts and interpreted economic data for equity and fixed income portfolio managers. Also at Chancellor, Mr. Moeller worked as an equity analyst and was responsible for researching and rating companies in the economically sensitive automobile and housing industries for investment in Chancellor’s equity portfolio. Prior to joining Chancellor, Mr. Moeller was an Economist at Citibank from 1979 to 1984. He also analyzed pricing behavior in the metals industry for the Council on Wage and Price Stability in Washington, D.C. In 1999, Mr. Moeller received the award for most accurate forecast from the Forecasters' Club of New York. From 1990 to 1992 he was President of the New York Association for Business Economists. Mr. Moeller earned an M.B.A. in Finance from Fordham University, where he graduated in 1987. He holds a Bachelor of Arts in Economics from George Washington University.
More Economy in Brief

 Global| Feb 05 2026
Charts of the Week: Balanced Policy, Resilient Data and AI Narratives
by:Andrew Cates

