 Global| Jun 06 2013
U.S. Flow of Funds Show Modest Reduction in Q1 Credit Market Borrowing
Summary
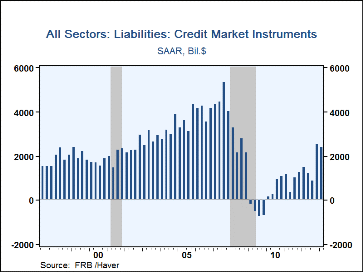
Federal Reserve flow-of-funds data for Q1 show the net volume of credit market borrowing at a $2.4 trillion annual rate, very similar to Q4's $2.5 trillion; the earlier figure is revised somewhat from $2.3 trillion reported before. [...]
Federal Reserve flow-of-funds data for Q1 show the net volume of credit market borrowing at a $2.4 trillion annual rate, very similar to Q4's $2.5 trillion; the earlier figure is revised somewhat from $2.3 trillion reported before. Q1's credit demand amounted to 14.9% of GDP, down from 15.9% in Q4. The Q1 reduction still left the ratio to GDP well above any other period since 2008. However, all major nonfinancial sectors borrowed at least somewhat less than in Q4.
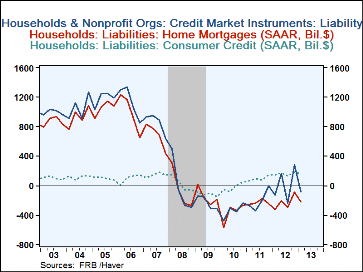
Households, in fact, liquidated debt once again in Q1, at a -$77 billion annual rate, after borrowing at a relatively large $280 billion rate in Q4. They had net paydowns of home mortgages and somewhat less consumer credit borrowing; loans from depository institutions were also paid down following a bulge in Q4.
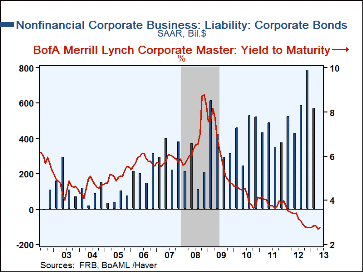
Nonfinancial corporations reduced their borrowing in Q1 to a $665 billion annual rate from $1.019 trillion in Q4. Corporate bonds were still the main tool, as long-term interest rates remain low (readily apparent in the graph nearby), although the amount was "just" $570 billion, down from $782 billion in Q4; most other types of corporate borrowing, such as bank loans and commercial paper, were also less than in Q4.
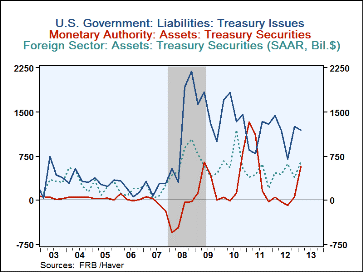
The federal government raised $1.198 trillion at an annual rate from credit markets in Q1, down from $1.259 trillion in Q4. In part the reduction in public borrowing was due to an increase in debt holdings by the government's pension funds, such as civil service and military retirement. The Treasury's public debt was acquired by two notable funding sources: the Federal Reserve bought a net of $575 billion and "rest of the world" investors $654 billion. These amounts are both sizable increases from most recent quarters, although far from record amounts.
The Flow of Funds data are in Haver's FFUNDS database. This latest release includes some restructuring of the tables in the data presentation and also highlights more on the Integrated Macroeconomic Accounts, which are produced jointly with the Bureau of Economic Analysis. Haver carries those tables in its USNA database.
Carol Stone, CBE
AuthorMore in Author Profile »Carol Stone, CBE came to Haver Analytics in 2003 following more than 35 years as a financial market economist at major Wall Street financial institutions, most especially Merrill Lynch and Nomura Securities. She had broad experience in analysis and forecasting of flow-of-funds accounts, the federal budget and Federal Reserve operations. At Nomura Securities, among other duties, she developed various indicator forecasting tools and edited a daily global publication produced in London and New York for readers in Tokyo. At Haver Analytics, Carol was a member of the Research Department, aiding database managers with research and documentation efforts, as well as posting commentary on select economic reports. In addition, she conducted Ways-of-the-World, a blog on economic issues for an Episcopal-Church-affiliated website, The Geranium Farm. During her career, Carol served as an officer of the Money Marketeers and the Downtown Economists Club. She had a PhD from NYU's Stern School of Business. She lived in Brooklyn, New York, and had a weekend home on Long Island.
More Economy in Brief
 Global| Feb 05 2026
Charts of the Week: Balanced Policy, Resilient Data and AI Narratives
by:Andrew Cates


