 Global| Jan 30 2015
U.S. GDP Growth Halves to 2.6% in Q4; 2014 Roughly Steady
by:Tom Moeller
|in:Economy in Brief
Summary
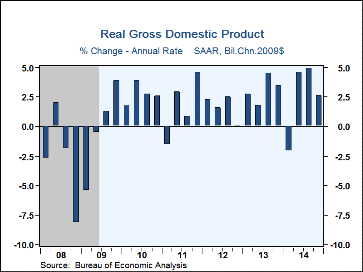
Real GDP growth last quarter slowed to 2.6% (AR, 2.5% y/y) from 5.0% in Q3. For all of 2014, growth of 2.4% compared to 2.2% and 2.3% during the prior two years. The latest gain fell short of a 3.3% rise in the Action Economics [...]
Real GDP growth last quarter slowed to 2.6% (AR, 2.5% y/y) from 5.0% in Q3. For all of 2014, growth of 2.4% compared to 2.2% and 2.3% during the prior two years. The latest gain fell short of a 3.3% rise in the Action Economics Forecast Survey.
Overall growth in final sales decelerated to 1.8% (2.2% y/y) from 5.0% as net export deterioration sapped one percentage point from growth, reversing its addition in Q3. The subtraction occurred as imports grew at an 8.9% rate (5.3% y/y), outpacing export growth of 2.8% (2.0% y/y). Working the other way, faster inventory accumulation raised GDP growth last quarter by 0.8 percentage points.
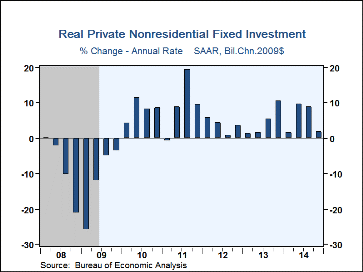
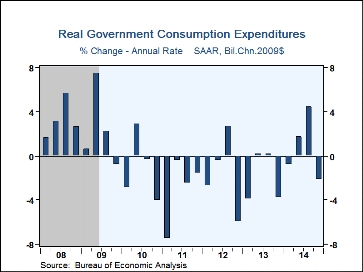
Growth in domestic final demand slowed sharply to 2.8% (2.8% y/y) from 4.1%. Holding back growth was a lessened 1.9% rise (5.5% y/y) in business fixed investment, down from 8.9% in Q3. The slowdown reflected a 1.9% decline (+4.7% y/y) in equipment spending, off from double-digit growth in the prior two quarters. Government spending also declined 2.2% (+0.7% y/y), held back by a 12.6% drop (-0.4% y/y) in defense. State & local government spending growth was stable at 1.3% (1.1% y/y).
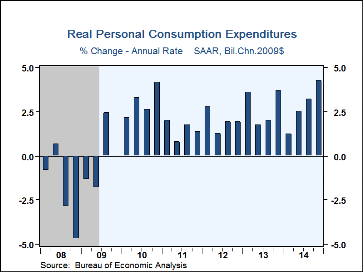
Faster growth in consumer spending picked up some of this slack. A 4.1% rise (2.8% y/y) in consumption was the strongest since Q1 2006. Quicker 4.4% growth (2.3% y/y) in spending on nondurables reflected a 13.4% rise (3.9% y/y) in apparel and a 12.3% gain (2.9% y/y) in gasoline & fuel oil, spurred by lower prices. Services spending also picked up to 3.7% (2.1% y/y) from 2.5%. It was sparked by a 6.0% jump (3.7% y/y) in restaurants & accommodations as well as a 5.9% surge (0.7% y/y) in recreation. Durable goods purchases eased to 7.5% growth (8.4% y/y) from 9.2%. Motor vehicles & parts purchases slowed to 6.4% (10.4% y/y) from 11.2% though spending on furnishings & household durables remained firm at 5.7% (6.3% y/y).
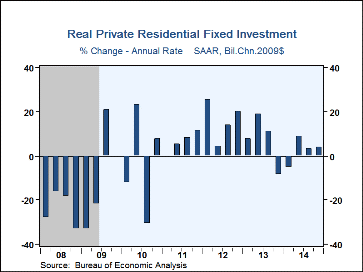
Residential investment also grew at a slightly quicker 4.1% rate last quarter (2.6% y/y), though this compares to double-digit growth in 2012 & 2013.
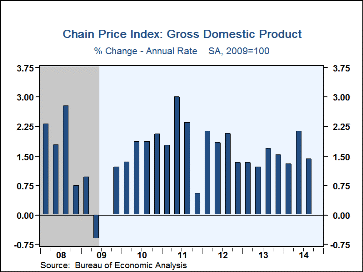
The GDP chain price index was nearly unchanged (1.2% y/y) following a 1.4% rise. The personal consumption price index fell at a 0.5% rate (+1.1% y/y). A 6.2% decline in the nondurable price index (-0.3% y/y) added to 3.6% decline (-2.6% y/y) in the durables index. The services price index rose at a stable 2.0% rate (2.2% y/y). The PCE price index excluding food & energy increased at a 1.1% rate (1.4% y/y), its weakest rise Q2'13
The latest GDP figures can be found in Haver's USECON and USNA databases; USNA contains basically all of the Bureau of Economic Analysis' detail in the national accounts, including the integrated economic accounts and the recently added GDP data for U.S. Territories. The Action Economics consensus estimates can be found in AS1REPNA.
Components of U.S. Financial Sector Growth, 1950-2013 from the Federal Reserve Bank of New York can be found here.
| Chained 2009 $, %, AR | Q4'14 (Advance Estimate) | Q3'14 | Q2'14 | Q4 Y/Y | 2014 | 2013 | 2012 |
|---|---|---|---|---|---|---|---|
| Gross Domestic Product | 2.6 | 5.0 | 4.6 | 2.5 | 2.4 | 2.2 | 2.3 |
| Inventory Effect | 0.8 | -0.0 | 1.4 | 0.3 | 0.1 | 0.0 | 0.1 |
| Final Sales | 1.8 | 5.0 | 3.2 | 2.2 | 2.3 | 2.2 | 2.2 |
| Foreign Trade Effect | -1.0 | 0.8 | -0.3 | -0.6 | -0.1 | 0.3 | 0.1 |
| Domestic Final Sales | 2.8 | 4.1 | 3.4 | 2.8 | 2.4 | 1.9 | 2.1 |
| Demand Components | |||||||
| Personal Consumption Expenditures | 4.3 | 3.2 | 2.5 | 2.8 | 2.5 | 2.4 | 1.8 |
| Business Fixed Investment | 1.9 | 8.9 | 9.7 | 5.5 | 6.1 | 3.0 | 7.2 |
| Residential Investment | 4.1 | 3.3 | 8.8 | 2.6 | 1.6 | 11.9 | 13.5 |
| Government Spending | -2.2 | 4.4 | 1.7 | 0.7 | -0.2 | -2.0 | -1.4 |
| Chain-Type Price Index | |||||||
| GDP | -0.0 | 1.4 | 2.1 | 1.2 | 1.5 | 1.5 | 1.8 |
| Personal Consumption Expenditures | -0.5 | 1.2 | 2.3 | 1.1 | 1.3 | 1.2 | 1.8 |
| Less Food/Energy | 1.1 | 1.4 | 2.0 | 1.4 | 1.4 | 1.3 | 1.8 |
Tom Moeller
AuthorMore in Author Profile »Prior to joining Haver Analytics in 2000, Mr. Moeller worked as the Economist at Chancellor Capital Management from 1985 to 1999. There, he developed comprehensive economic forecasts and interpreted economic data for equity and fixed income portfolio managers. Also at Chancellor, Mr. Moeller worked as an equity analyst and was responsible for researching and rating companies in the economically sensitive automobile and housing industries for investment in Chancellor’s equity portfolio. Prior to joining Chancellor, Mr. Moeller was an Economist at Citibank from 1979 to 1984. He also analyzed pricing behavior in the metals industry for the Council on Wage and Price Stability in Washington, D.C. In 1999, Mr. Moeller received the award for most accurate forecast from the Forecasters' Club of New York. From 1990 to 1992 he was President of the New York Association for Business Economists. Mr. Moeller earned an M.B.A. in Finance from Fordham University, where he graduated in 1987. He holds a Bachelor of Arts in Economics from George Washington University.
More Economy in Brief
 Global| Feb 05 2026
Charts of the Week: Balanced Policy, Resilient Data and AI Narratives
by:Andrew Cates


