 Global| Nov 18 2009
U.S. Home Builders’ Index Recovery Stuttering Again This Month
by:Tom Moeller
|in:Economy in Brief
Summary
Since the spring recovery, housing activity has been roughly flat according to The National Association of Home Builders. They reported that its November Composite Housing Market Index held stable with a downwardly revised October [...]
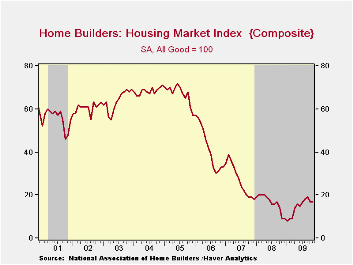 Since
the spring recovery, housing activity has been roughly flat according
to The National Association of Home Builders. They reported that its
November Composite Housing Market Index held stable with a downwardly
revised October reading. Though the index remained double the low of 8
this past January there's been little, if any, improvement during the
last several months. The index is compiled from survey questions asking
builders to rate market conditions as “good”, “fair”, “poor” or “very
high” to “very low”. The figure is a
diffusion index, therefore, numerical results over 50 indicate a
predominance of “good” readings.
Since
the spring recovery, housing activity has been roughly flat according
to The National Association of Home Builders. They reported that its
November Composite Housing Market Index held stable with a downwardly
revised October reading. Though the index remained double the low of 8
this past January there's been little, if any, improvement during the
last several months. The index is compiled from survey questions asking
builders to rate market conditions as “good”, “fair”, “poor” or “very
high” to “very low”. The figure is a
diffusion index, therefore, numerical results over 50 indicate a
predominance of “good” readings.
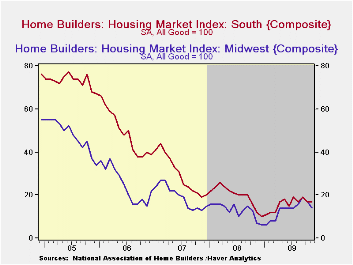
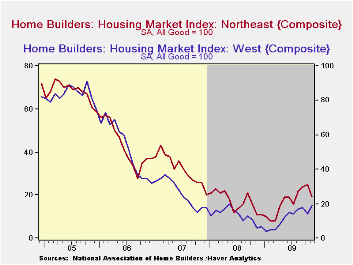 The present sales
index held stable at 17 which equaled the 3Q average. In the West the
index rose slightly and was sharply higher than one year ago. In the
South the index also held stable m/m (+41.7% y/y). In the Northeast the
index fell m/m but remained three-quarters higher than the year-ago
level. In the Midwest the index also fell m/m but remained
double last year. The sub-index of sales during the next six months
rose slightly m/m and offset most of the October decline.
· The Home Builders' Association also reported that traffic of
prospective buyers held stable with October at the lowest level since
July.</p><p>The Home Builders' Housing
Opportunity Index,
which is the share of homes sold that could be considered affordable to
a family earning the median income, fell slightly in the second
quarter. It had jumped earlier to a record high of 72.5% buoyed by
lower home prices, lower interest rates and higher income. (There is a
break in the series from 2002 to 2003.)
The present sales
index held stable at 17 which equaled the 3Q average. In the West the
index rose slightly and was sharply higher than one year ago. In the
South the index also held stable m/m (+41.7% y/y). In the Northeast the
index fell m/m but remained three-quarters higher than the year-ago
level. In the Midwest the index also fell m/m but remained
double last year. The sub-index of sales during the next six months
rose slightly m/m and offset most of the October decline.
· The Home Builders' Association also reported that traffic of
prospective buyers held stable with October at the lowest level since
July.</p><p>The Home Builders' Housing
Opportunity Index,
which is the share of homes sold that could be considered affordable to
a family earning the median income, fell slightly in the second
quarter. It had jumped earlier to a record high of 72.5% buoyed by
lower home prices, lower interest rates and higher income. (There is a
break in the series from 2002 to 2003.)
 The NAHB
has compiled the Housing Market Index since 1985. The weights assigned
to the individual index components are .5920 for single family detached
sales, present time; .1358 for single family detached sales, next six
months; and .2722 for traffic of prospective buyers. The results, along
with other housing and remodeling indexes from NAHB Economics, are
included in Haver’s SURVEYS database.
The NAHB
has compiled the Housing Market Index since 1985. The weights assigned
to the individual index components are .5920 for single family detached
sales, present time; .1358 for single family detached sales, next six
months; and .2722 for traffic of prospective buyers. The results, along
with other housing and remodeling indexes from NAHB Economics, are
included in Haver’s SURVEYS database.
| Nat'l Association of Home Builders | November | October | September | November '08 | 2008 | 2007 | 2006 |
|---|---|---|---|---|---|---|---|
| Composite Housing Market Index (All Good = 100) | 17 | 17 | 19 | 9 | 16 | 27 | 42 |
| Single-Family Sales | 17 | 17 | 18 | 9 | 16 | 27 | 45 |
| Single-Family Sales: Next Six Months | 28 | 26 | 29 | 18 | 25 | 37 | 51 |
| Traffic of Prospective Buyers | 13 | 13 | 17 | 7 | 14 | 21 | 30 |

Tom Moeller
AuthorMore in Author Profile »Prior to joining Haver Analytics in 2000, Mr. Moeller worked as the Economist at Chancellor Capital Management from 1985 to 1999. There, he developed comprehensive economic forecasts and interpreted economic data for equity and fixed income portfolio managers. Also at Chancellor, Mr. Moeller worked as an equity analyst and was responsible for researching and rating companies in the economically sensitive automobile and housing industries for investment in Chancellor’s equity portfolio. Prior to joining Chancellor, Mr. Moeller was an Economist at Citibank from 1979 to 1984. He also analyzed pricing behavior in the metals industry for the Council on Wage and Price Stability in Washington, D.C. In 1999, Mr. Moeller received the award for most accurate forecast from the Forecasters' Club of New York. From 1990 to 1992 he was President of the New York Association for Business Economists. Mr. Moeller earned an M.B.A. in Finance from Fordham University, where he graduated in 1987. He holds a Bachelor of Arts in Economics from George Washington University.
More Economy in Brief

 Global| Feb 05 2026
Charts of the Week: Balanced Policy, Resilient Data and AI Narratives
by:Andrew Cates

