 Global| Nov 20 2018
U.S. Housing Starts Increase
by:Tom Moeller
|in:Economy in Brief
Summary
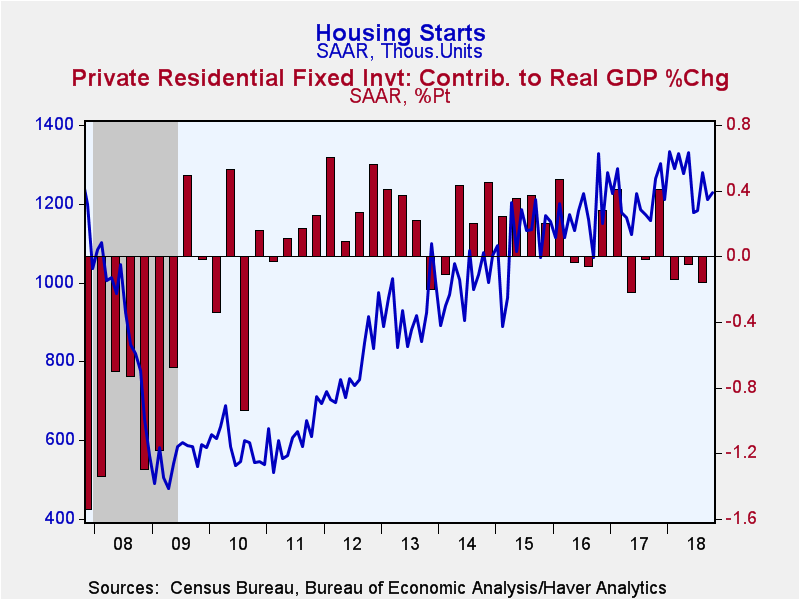
Total housing starts rose 1.5% (-2.9% y/y) during October to 1.228 million units (AR) from 1.210 million in September, revised from 1.201 million. The rise matched expectations for 1.228 million starts in the Action Economics Forecast [...]
Total housing starts rose 1.5% (-2.9% y/y) during October to 1.228 million units (AR) from 1.210 million in September, revised from 1.201 million. The rise matched expectations for 1.228 million starts in the Action Economics Forecast Survey.
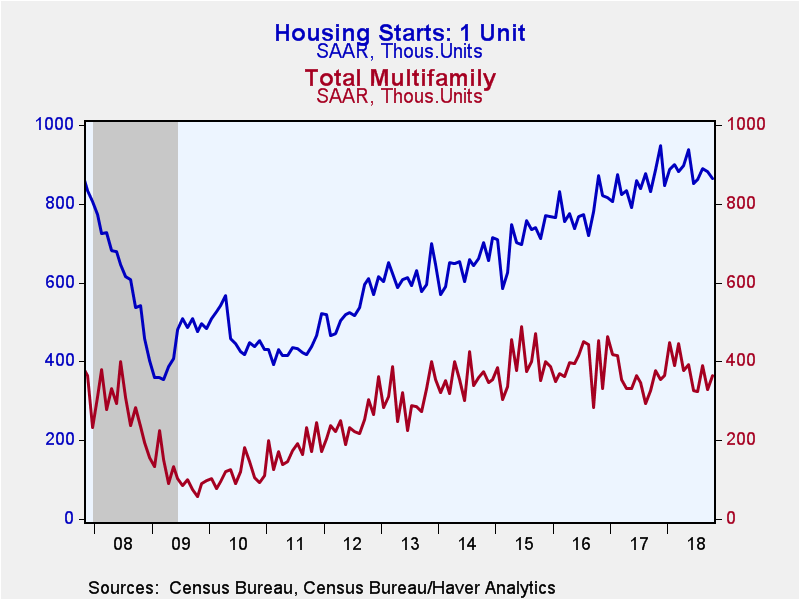
A 10.3% rise (-3.7% y/y) in starts of multi-family units to 363,000 accounted for last month's rise in the total. It followed a 15.6% decline. Starts of single-family units fell 1.8% (-2.6% y/y) to 865,000, down for the second straight month.
Last month's increase reflected a one-third improvement (5.0% y/y) in the Midwest to 210,000 units from 158,000. Starts in the South rose 4.7% (-3.4% y/y) to 596,000 from 569,000. Countering these increases was a 34.1% decline in the Northeast to 87,000 (-40.0% y/y), which more-than-reversed the rise during September. Housing starts in the West fell 4.6% (+10.6% y/y) to 335,000 as it countered the prior month's increase.
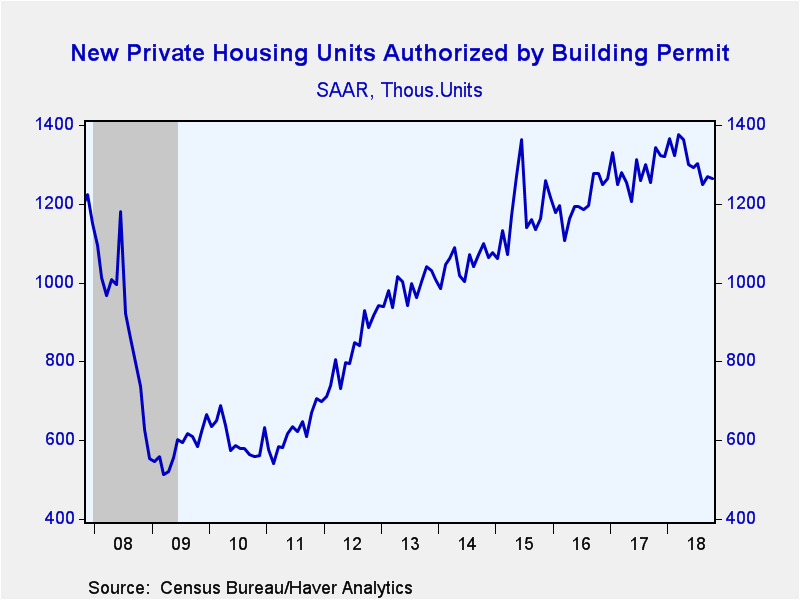
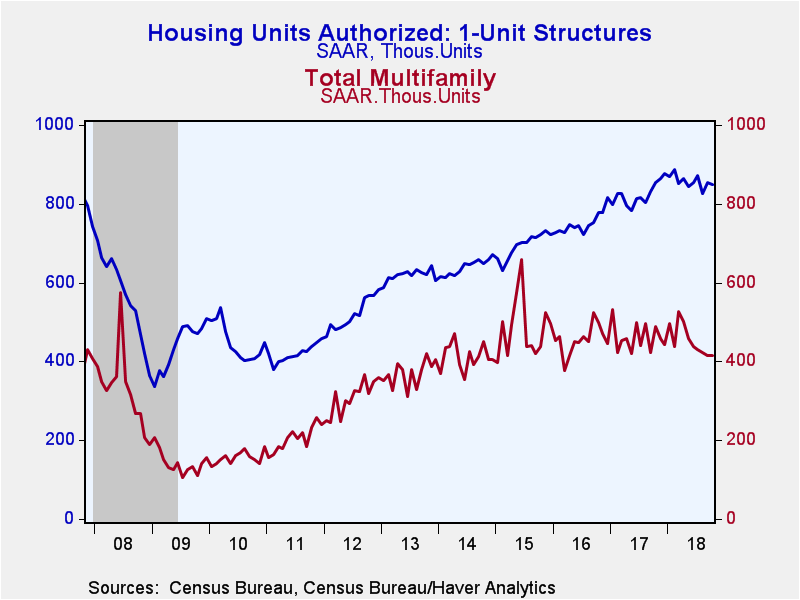
Building permits slipped 0.6% (-6.0% y/y) to 1.263 million from 1.270 million after a 1.7% increase. Single-family permits eased 0.6% both m/m and y/y to 849,000. Permits to build multi-family homes slipped 0.5% (-15.3% y/y) to 414,000, the lowest level since March 2016.
The housing starts and permits figures can be found in Haver's USECON database. The expectations figure is contained in the AS1REPNA database.
| Housing Starts (000s, SAAR) | Oct | Sep | Aug | Oct Y/Y % | 2017 | 2016 | 2015 |
|---|---|---|---|---|---|---|---|
| Total | 1,228 | 1,210 | 1,280 | -2.9 | 1,208 | 1,177 | 1,107 |
| Single-Family | 865 | 881 | 890 | -2.6 | 852 | 785 | 713 |
| Multi-Family | 363 | 329 | 390 | -3.7 | 356 | 393 | 394 |
| Starts By Region | |||||||
| Northeast | 87 | 132 | 99 | 18.8 | 111 | 116 | 135 |
| Midwest | 210 | 158 | 187 | 5.0 | 180 | 185 | 150 |
| South | 596 | 569 | 657 | -3.4 | 603 | 585 | 557 |
| West | 335 | 351 | 337 | 10.6 | 314 | 292 | 265 |
| Building Permits | 1,263 | 1,270 | 1,249 | -6.0 | 1,286 | 1,206 | 1,178 |
Tom Moeller
AuthorMore in Author Profile »Prior to joining Haver Analytics in 2000, Mr. Moeller worked as the Economist at Chancellor Capital Management from 1985 to 1999. There, he developed comprehensive economic forecasts and interpreted economic data for equity and fixed income portfolio managers. Also at Chancellor, Mr. Moeller worked as an equity analyst and was responsible for researching and rating companies in the economically sensitive automobile and housing industries for investment in Chancellor’s equity portfolio. Prior to joining Chancellor, Mr. Moeller was an Economist at Citibank from 1979 to 1984. He also analyzed pricing behavior in the metals industry for the Council on Wage and Price Stability in Washington, D.C. In 1999, Mr. Moeller received the award for most accurate forecast from the Forecasters' Club of New York. From 1990 to 1992 he was President of the New York Association for Business Economists. Mr. Moeller earned an M.B.A. in Finance from Fordham University, where he graduated in 1987. He holds a Bachelor of Arts in Economics from George Washington University.
More Economy in Brief
 Global| Feb 05 2026
Charts of the Week: Balanced Policy, Resilient Data and AI Narratives
by:Andrew Cates


