 Global| Sep 19 2019
U.S. Initial Claims for Unemployment Insurance Increase to 208K
Summary
Initial claims for unemployment insurance in the week ending September 14 increased 2,000 to 208,000 (-1.9% y/y) from an upwardly revised 206,000 in the previous week (originally 204,000). The Action Economics Forecast Survey expected [...]
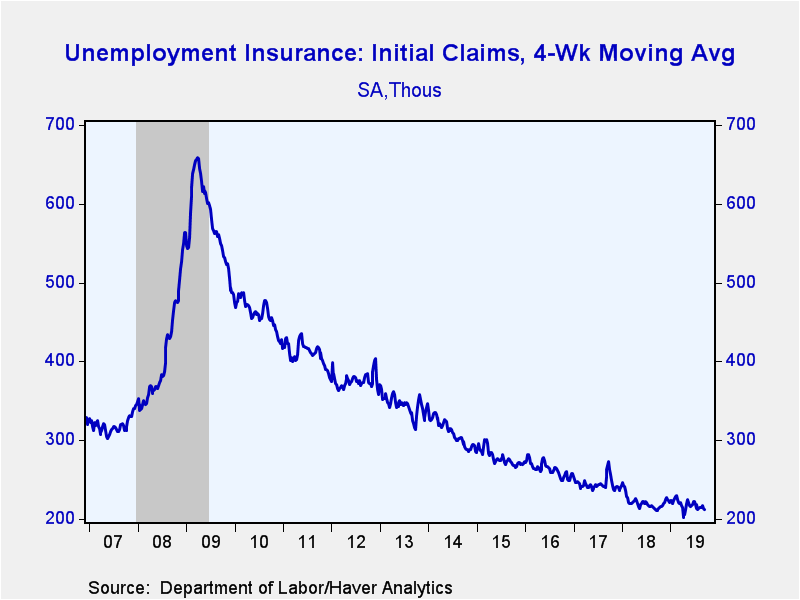
Initial claims for unemployment insurance in the week ending September 14 increased 2,000 to 208,000 (-1.9% y/y) from an upwardly revised 206,000 in the previous week (originally 204,000). The Action Economics Forecast Survey expected 211,000. The four-week moving average of initial claims, which smooths out week-to-week volatility, declined to 212,250 from 213,000.
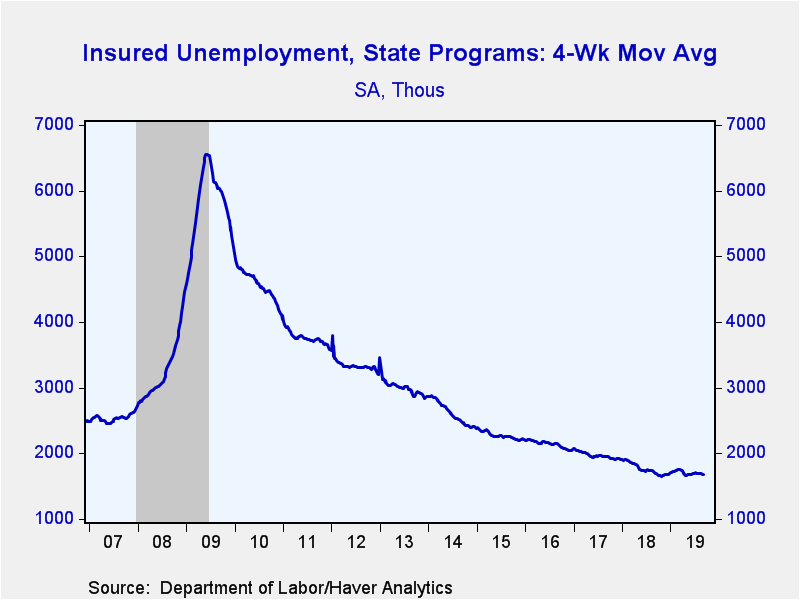
Continuing claims for unemployment insurance fell 13,000 to 1.661 million (-0.2% y/y) in the week ending September 7 from 1.674 million in the prior week, upwardly revised from 1.670 million. The 1.661 million reading was the lowest since April 13. The four-week moving average of claimants declined to 1.678 million from 1.681 million.
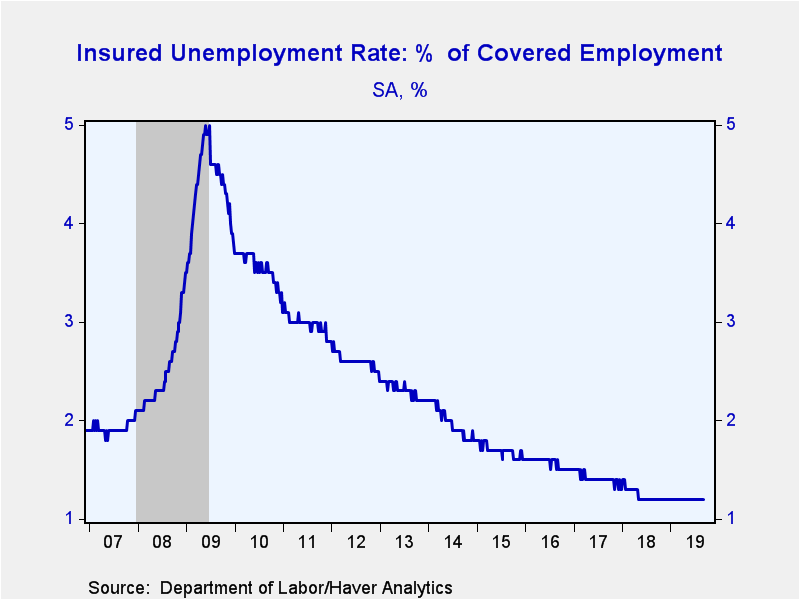
The insured rate of unemployment for the week ending September 7 remained at the record low 1.2%, where it has been since May 2018. Data on the insured unemployment rate go back to 1971.
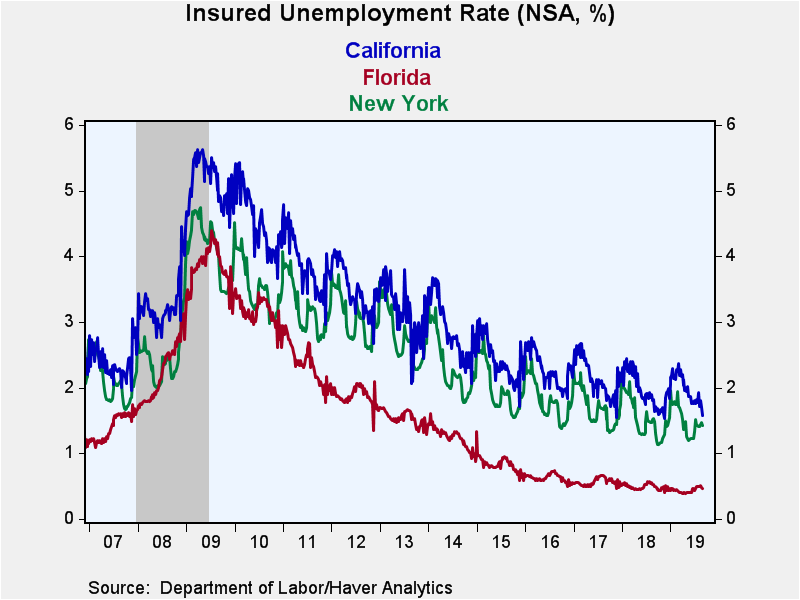
Insured rates of unemployment vary widely by state. During the week ending August 31, the lowest rates were in South Dakota (0.20%), Nebraska (0.32%), Kentucky (0.35%), Utah (0.41%), and Indiana (0.43%). The highest rates were in Alaska (1.48%), California (1.57%), Pennsylvania (1.71%), Connecticut (1.83%), and New Jersey (2.33%). Among the other largest states by population not mentioned above, the rate was 0.96% in Texas, 0.47% in Florida, and 1.42% in New York. These state data are not seasonally adjusted.
Data on weekly unemployment claims going back to 1967 are contained in Haver's WEEKLY database, and they are summarized monthly in USECON. Data for individual states are in REGIONW. The expectations figure is from the Action Economics Forecast Survey, carried in the AS1REPNA database.
| Unemployment Insurance (SA, 000s) | 09/14/19 | 09/07/19 | 08/31/19 | Y/Y % | 2018 | 2017 | 2016 |
|---|---|---|---|---|---|---|---|
| Initial Claims | 208 | 206 | 219 | -1.9 | 220 | 244 | 262 |
| Continuing Claims | -- | 1,661 | 1,674 | -0.2 | 1,756 | 1,961 | 2,135 |
| Insured Unemployment Rate (%) | -- | 1.2 | 1.2 |
1.2 |
1.2 | 1.4 | 1.6 |
Winnie Tapasanun
AuthorMore in Author Profile »Winnie Tapasanun has been working for Haver Analytics since 2013. She has 20+ years of working in the financial services industry. As Vice President and Economic Analyst at Globicus International, Inc., a New York-based company specializing in macroeconomics and financial markets, Winnie oversaw the company’s business operations, managed financial and economic data, and wrote daily reports on macroeconomics and financial markets. Prior to working at Globicus, she was Investment Promotion Officer at the New York Office of the Thailand Board of Investment (BOI) where she wrote monthly reports on the U.S. economic outlook, wrote reports on the outlook of key U.S. industries, and assisted investors on doing business and investment in Thailand. Prior to joining the BOI, she was Adjunct Professor teaching International Political Economy/International Relations at the City College of New York. Prior to her teaching experience at the CCNY, Winnie successfully completed internships at the United Nations. Winnie holds an MA Degree from Long Island University, New York. She also did graduate studies at Columbia University in the City of New York and doctoral requirements at the Graduate Center of the City University of New York. Her areas of specialization are international political economy, macroeconomics, financial markets, political economy, international relations, and business development/business strategy. Her regional specialization includes, but not limited to, Southeast Asia and East Asia. Winnie is bilingual in English and Thai with competency in French. She loves to travel (~30 countries) to better understand each country’s unique economy, fascinating culture and people as well as the global economy as a whole.


