 Global| Dec 24 2009
U.S. Initial Jobless InsuranceClaims Fall Back To New Low
by:Tom Moeller
|in:Economy in Brief
Summary
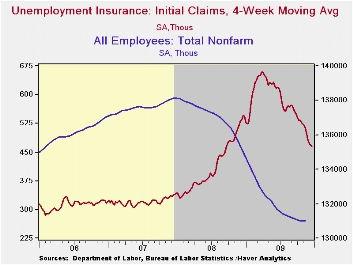
The jobs market resumed its recent trend toward improvement. The Labor Department reported that initial claims for unemployment insurance fell to 452,000 from an unrevised 480,000 during the prior week. Claims now stand at the lowest [...]
 The jobs
market resumed its recent trend toward improvement. The Labor
Department reported that initial claims for unemployment insurance fell
to 452,000 from an unrevised 480,000 during the prior week. Claims now
stand at the lowest level since the first week of September 2008 and
were down from the recession peak of 674,000 hit in March. The
four-week moving average of claims also fell to a new low of 465,250.
The latest weekly figure was lower than Consensus expectations for
470,000 claims.
The jobs
market resumed its recent trend toward improvement. The Labor
Department reported that initial claims for unemployment insurance fell
to 452,000 from an unrevised 480,000 during the prior week. Claims now
stand at the lowest level since the first week of September 2008 and
were down from the recession peak of 674,000 hit in March. The
four-week moving average of claims also fell to a new low of 465,250.
The latest weekly figure was lower than Consensus expectations for
470,000 claims.
Continuing claims for unemployment insurance during the latest week fell 127,000 after an upwardly revised 40,000 gain during the prior week. Continuing claims were at the lowest level since February. The overall decline is a function of the improved job market but also reflects the exhaustion of 26 weeks of unemployment benefits. Continuing claims provide an indication of workers' ability to find employment. The four-week average of continuing claims fell to 5,233,000. This series dates back to 1966.
 Extended
benefits for unemployment insurance dropped sharply to 393,956 during
the first week of December. The latest was down from the peak during
last month of 597,688.
Extended
benefits for unemployment insurance dropped sharply to 393,956 during
the first week of December. The latest was down from the peak during
last month of 597,688.
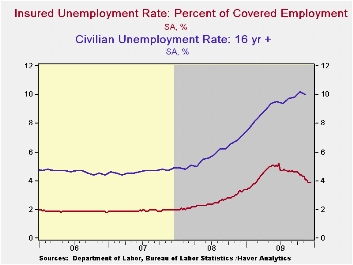
The insured rate of unemployment remained stable at 3.9%, the lowest level since February. The rate reached a high of 5.2% during late-June. During the last ten years, there has been a 93% correlation between the level of the insured unemployment rate and the overall rate of unemployment published by the Bureau of Labor Statistics.
p>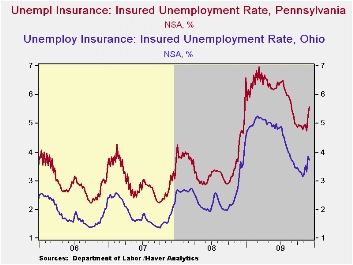 The highest insured unemployment rates in
the week ending December 5 were in Puerto Rico (6.4%), Oregon
(5.9), Pennsylvania (5.6), Wisconsin (5.6), Alaska (5.5), Nevada (5.2),
Michigan (4.9), California (4.9) and South Carolina (4.7). The lowest
insured unemployment rates were in North Dakota (1.7%), Virginia (2.0),
Texas (2.5), Wyoming (3.0), Maine (3.3), Maryland (3.4), Mississippi
(3.4), Florida (3.5), New York (3.7) and Ohio (3.7). The data are not
seasonally adjusted but the overall insured unemployment rate is.
The highest insured unemployment rates in
the week ending December 5 were in Puerto Rico (6.4%), Oregon
(5.9), Pennsylvania (5.6), Wisconsin (5.6), Alaska (5.5), Nevada (5.2),
Michigan (4.9), California (4.9) and South Carolina (4.7). The lowest
insured unemployment rates were in North Dakota (1.7%), Virginia (2.0),
Texas (2.5), Wyoming (3.0), Maine (3.3), Maryland (3.4), Mississippi
(3.4), Florida (3.5), New York (3.7) and Ohio (3.7). The data are not
seasonally adjusted but the overall insured unemployment rate is.
The unemployment insurance claims data is available in Haver's WEEKLY database and the state data is in the REGIONW database.
| Unemployment Insurance (000s) | 12/19/09 | 12/12/09 | 12/05/09 | Y/Y | 2008 | 2007 | 2006 |
|---|---|---|---|---|---|---|---|
| Initial Claims | 452 | 480 | 475 | -19.9% | 420 | 321 | 313 |
| Continuing Claims | -- | 5,076 | 5,203 | 17.2% | 3,342 | 2,552 | 2,459 |
| Insured Unemployment Rate (%) | -- | 3.9 | 3.9 | 3.3 (12/2008) | 2.5 | 1.9 | 1.9 |
by Tom Moeller December 24, 2009
 Despite
only
a modest rise in November durable goods orders, the trend has improved
sharply. Durable goods orders rose 0.2% last month after an unrevised
0.6% October decline. The latest increase lifted orders 5.4% above the
March low and the y/y decline of 7.8% compares with a peak 26.6%
decline last winter. A 0.5% November gain had been the Consensus
expectation.
Despite
only
a modest rise in November durable goods orders, the trend has improved
sharply. Durable goods orders rose 0.2% last month after an unrevised
0.6% October decline. The latest increase lifted orders 5.4% above the
March low and the y/y decline of 7.8% compares with a peak 26.6%
decline last winter. A 0.5% November gain had been the Consensus
expectation.
A 5.5% (-10.9% y/y) decline in transportation equipment orders in fact masked the degree of improvement in overall orders. Transportation orders were pulled down by a 32.6% (-3.7% y/y) decline in civilian aircraft. Excluding transportation altogether, orders rose 2.0% during November and have risen 7.3% from their April low.
 Primary
metals orders also continued their recovery with a 1.4% November
increase (-7.3% y/y) and they have risen one-quarter from the March
low. Electrical equipment orders rose about as they did during October.
The 3.2% gain lifted orders 10.0% from the spring low. Orders for
computers & related equipment also improved for the second
month by 1.6% during November. The increase lifted them 14.9% above
April's low. Finally, machinery orders increased 3.5% (-14.0% y/y),
made up half of the October decline and raised them 9.8% from the low.
Primary
metals orders also continued their recovery with a 1.4% November
increase (-7.3% y/y) and they have risen one-quarter from the March
low. Electrical equipment orders rose about as they did during October.
The 3.2% gain lifted orders 10.0% from the spring low. Orders for
computers & related equipment also improved for the second
month by 1.6% during November. The increase lifted them 14.9% above
April's low. Finally, machinery orders increased 3.5% (-14.0% y/y),
made up half of the October decline and raised them 9.8% from the low.
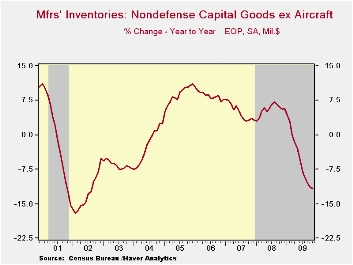
The decline in aircraft bookings also masked improvement in other capital goods orders. Nondefense capital goods orders less aircraft more than recovered the October slump with a 2.9% increase and they now are 9.8% above the April low.
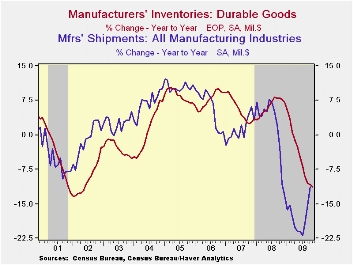
 Shipments of durable goods ticked up
0.3% (-8.8% y/y) during November following increases in two of the
prior three months. Shipments now have risen 4.4% from the April low.
The improvement has been paced by strong monthly gains in shipments of
metals (-16.6% y/y), up 24.2% from the low. Machinery orders rose 2.0%
(-20.3% y/y) after touching the cycle low in October. Electrical
equipment orders rose 2.2% (-9.1% y/y), about as they did in October.
Shipments of durable goods ticked up
0.3% (-8.8% y/y) during November following increases in two of the
prior three months. Shipments now have risen 4.4% from the April low.
The improvement has been paced by strong monthly gains in shipments of
metals (-16.6% y/y), up 24.2% from the low. Machinery orders rose 2.0%
(-20.3% y/y) after touching the cycle low in October. Electrical
equipment orders rose 2.2% (-9.1% y/y), about as they did in October.
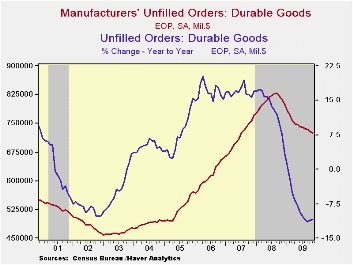
As was suggested by the October data, the shedding of inventories of durable manufactured goods seems to be ending after nearly a year of correction. Durable goods inventories slipped 0.2% (-11.3% y/y) after no change during October. Declines in inventories lowered the ratio to shipments to its lowest since October of last year.. Unfilled orders fell another 0.7% (-10.9% y/y) led by declines in the transportation sector. Less transportation backlogs rose 0.1% (-11.4% y/y) for the second gain in three months.
The durable goods figures are available in Haver's USECON database.
| NAICS Classification (%) | November | October | September | Y/Y | 2008 | 2007 | 2006 |
|---|---|---|---|---|---|---|---|
| Durable Goods Orders | 0.2 | -0.6 | 2.2 | -7.8 | -5.8 | 1.4 | 6.2 |
| Excluding Transportation | 2.0 | -0.7 | 2.1 | -6.9 | -1.2 | -0.3 | 9.1 |
| Nondefense Capital Goods | -1.9 | 0.8 | 3.4 | -11.1 | -6.8 | 3.5 | 9.4 |
| Excluding Aircraft | 2.9 | -2.0 | 2.9 | -10.2 | -0.3 | -2.7 | 10.7 |

Tom Moeller
AuthorMore in Author Profile »Prior to joining Haver Analytics in 2000, Mr. Moeller worked as the Economist at Chancellor Capital Management from 1985 to 1999. There, he developed comprehensive economic forecasts and interpreted economic data for equity and fixed income portfolio managers. Also at Chancellor, Mr. Moeller worked as an equity analyst and was responsible for researching and rating companies in the economically sensitive automobile and housing industries for investment in Chancellor’s equity portfolio. Prior to joining Chancellor, Mr. Moeller was an Economist at Citibank from 1979 to 1984. He also analyzed pricing behavior in the metals industry for the Council on Wage and Price Stability in Washington, D.C. In 1999, Mr. Moeller received the award for most accurate forecast from the Forecasters' Club of New York. From 1990 to 1992 he was President of the New York Association for Business Economists. Mr. Moeller earned an M.B.A. in Finance from Fordham University, where he graduated in 1987. He holds a Bachelor of Arts in Economics from George Washington University.
More Economy in Brief

 Global| Feb 05 2026
Charts of the Week: Balanced Policy, Resilient Data and AI Narratives
by:Andrew Cates

