 Global| Jun 13 2007
U.S. Inventory Cycle: At Its End?
Summary
The inventory cycle appears to be winding down. Three-month inventory growth rates peaked in July of 2006 and have now decelerated to growth of 1.3% and begun to rise again. Equally as important however, is the upturn in sales. The [...]
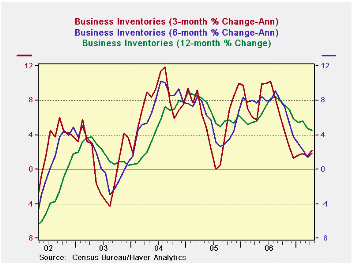
The inventory cycle appears to be winding down. Three-month inventory growth rates peaked in July of 2006 and have now decelerated to growth of 1.3% and begun to rise again. Equally as important however, is the upturn in sales.
The first table below puts these trends together and reveals sector detail. The very goods news is that over the last three- and six-months the three major sectors, wholesaling, retailing and manufacturing, each has seen the growth in sales exceed the growth in inventories. This means that Inventory/Sales (I/S) ratios have been reduced in each sector over the past six months. This sort of stock whittling is an encouragement to firms to rebuild inventories.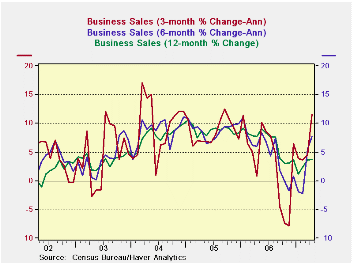
Moreover, the growth rate of sales has become quite strong and although retailing seems to lag, new figures for May tell us that retail sales are back in a strong growth profile. Over the past two years, however, manufacturers have had a problem: sales over the last 12 months and the past 24 months have lagged the growth in inventories leaving stocks ‘toppish’ relative to sales levels. For this sector even the robust - nearly 10% rise in nominal sales over the last 3-mos - will be a slow-acting medicine for inventory revival. Manufacturers will want to see more, or at least more sustainability.
Caveat: The top part of the first table below is all about dynamics: comparing the growth of inventories to the growth in sales over various periods. The changes in this growth balance are the stuff that shifting business fortunes are assessed over. But we also need to anchor these assessments, since the ebb and flow of sales versus inventories can make the relationship of ‘I’ to ‘S’ unclear. The bottom panel of the table provides an assessment of I to S ratios for that purpose. We also calculate the current I/S ratio as a percentage of its range over the last three years.
The latter calculation shows that while inventories are lean they are not so in all sectors. Wholesaling shows the lowest I to S ratio in three years. Retail inventories also are lean as they reside in the bottom 7 percentile of their 3-year range. As sales pick up, each of these sectors should see inventories grow as stock-to-sales ratios are so lean. But manufacturers, despite seeing the light at the end of their tunnel have been in that tunnel for a long time and have seen false glimmerings of light before. Inventories there are still in the top one quarter of their recent range for them. This not enough to keep them cutting stocks even as sales have truly picked up, so do not expect too much stock-building from this sector.
A second caveat is to be careful of aggregation when looking at inventories.
The second table below details retailing by sector and we see that lean motor vehicle inventories are driving the low reading for this sector (motor vehicles make up 43% of the sectors’ stocks, so that is not surprising). While most other industry groups within retailing are in good shape, building materials, with its stock-to-sales ratio at a three year high, is a clear exception. We do know that retail sales kicked it up a notch in May so these figures in the table below are going to look even better next month. But this is a warning that inventory figures are tricky and require a lot of effort to be well understood. For this sector, truth, not just the devil, is in the details. The aggregate figures really tell you nothing.
Summary:
On balance, these trends mean that US production should NOT get a huge kick from inventory-building since reporting factories are located in the US and if they build stocks they build them from US generated output by definition. And factories appear to be the laggard sector. Retailers, on the other hand, when they rebuild, will rebuild using imports to a great degree.
One implication of these trends is that imports are about to increase their growth to replenish dissipated stocks at the retail level. Wholesalers have a good complement of consumer goods and imports as well. The factory sector is the one that will kick US production into high gear when it rebuilds and so far that sector is still in the ‘yellow light’ region, not the ‘green light’ region, of its cycle at least for inventory building. But better times should be coming to that sector before long, especially if the current pace of sales has staying power.
| 3-Mo Growth | 6-Mo Growth | 12-Mo Growth | Yr Ago Growth | I:S ratio | |||||
| 2007 Apr | Sales | Inventory | Sales | Inventory | Sales | Inventory | Sales | Inventory | Percentile |
| Total Business | 11.7% | 2.2% | 7.7% | 1.9% | 3.8% | 4.6% | 7.7% | 5.6% | 33.3% |
| Manufacturers | 9.9% | 2.9% | 4.8% | 1.8% | 0.5% | 4.7% | 6.1% | 7.1% | 75.0% |
| Retailers | 6.3% | -0.2% | 6.2% | 0.0% | 2.9% | 2.5% | 7.0% | 2.9% | 6.7% |
| Wholesalers | 19.3% | 4.3% | 12.8% | 4.6% | 8.8% | 7.1% | 10.4% | 7.3% | 0.0% |
| Ratio of Stocks to Sales: Stocks Vs Flows | |||||||||
| Inventory-to-Sales Ratios In Perspective | Over three Years | ||||||||
| 2007 Apr | Current | 3-Mo Ago | 6-Mo Ago | Yr Ago | 2-Yrs Ago | 3-Yrs Ago | Percentile | Max | Min |
| Total Business | 1.27 | 1.30 | 1.31 | 1.26 | 1.29 | 1.29 | 33.3% | 1.31 | 1.25 |
| Manufacturers | 1.24 | 1.26 | 1.26 | 1.19 | 1.18 | 1.18 | 75.0% | 1.27 | 1.15 |
| Retailers | 1.46 | 1.49 | 1.51 | 1.47 | 1.53 | 1.58 | 6.7% | 1.6 | 1.45 |
| Wholesalers | 1.12 | 1.16 | 1.16 | 1.14 | 1.17 | 1.14 | 0.0% | 1.18 | 1.12 |
| 2007 Apr | 3-Mo Growth | 6-Mo Growth | 12-Mo Growth | Year Ago Growth | 3-Yr | ||||
| Sales | Inventory | Sales | Inventory | Sales | Inventory | Sales | Inventory | Percentile | |
| Retail Total | 6.3% | -0.2% | 6.2% | 0.0% | 2.9% | 2.5% | 7.0% | 2.9% | 11.1% |
| Excl Motor Vehicles | 7.1% | 3.3% | 7.4% | 3.5% | 3.2% | 4.3% | 8.9% | 3.9% | 14.3% |
| Sectors | |||||||||
| Motor Vehicles & Parts | 3.8% | -7.4% | 2.2% | -7.2% | 2.0% | -1.3% | 1.2% | 0.8% | 50.0% |
| Furniture, Electronics & Appliance | -0.4% | -0.1% | 4.8% | 1.1% | 3.1% | 1.0% | 8.2% | 5.9% | 18.2% |
| Building Materials | -4.4% | 15.8% | -1.2% | 2.6% | -5.6% | 1.7% | 14.4% | 9.4% | 100.0% |
| Clothing & Accessories | -4.9% | -1.8% | 3.9% | 7.9% | 4.6% | 8.5% | 5.6% | 5.6% | 76.2% |
| General Merchandise Stores | -1.3% | 3.9% | 4.3% | 5.3% | 3.1% | 7.4% | 6.2% | -2.0% | 50.0% |
| Percentage of Sectors where Sales Growth Exceeds Inventory Growth | |||||||||
| Sector Diffusion | 20 | 40 | 40 | 80 | |||||

Robert Brusca
AuthorMore in Author Profile »Robert A. Brusca is Chief Economist of Fact and Opinion Economics, a consulting firm he founded in Manhattan. He has been an economist on Wall Street for over 25 years. He has visited central banking and large institutional clients in over 30 countries in his career as an economist. Mr. Brusca was a Divisional Research Chief at the Federal Reserve Bank of NY (Chief of the International Financial markets Division), a Fed Watcher at Irving Trust and Chief Economist at Nikko Securities International. He is widely quoted and appears in various media. Mr. Brusca holds an MA and Ph.D. in economics from Michigan State University and a BA in Economics from the University of Michigan. His research pursues his strong interests in non aligned policy economics as well as international economics. FAO Economics’ research targets investors to assist them in making better investment decisions in stocks, bonds and in a variety of international assets. The company does not manage money and has no conflicts in giving economic advice.
More Economy in Brief

 Global| Feb 05 2026
Charts of the Week: Balanced Policy, Resilient Data and AI Narratives
by:Andrew Cates

