 Global| Apr 03 2020
U.S. ISM Nonmanufacturing Misleadingly Strong in March
Summary
• ISM Nonmanufacturing index declined substantially less than expected to 52.5. • COVID-19 related slowdown in supplier deliveries drove this reading. • Slower supplier deliveries normally suggest economic strength, but in this case [...]
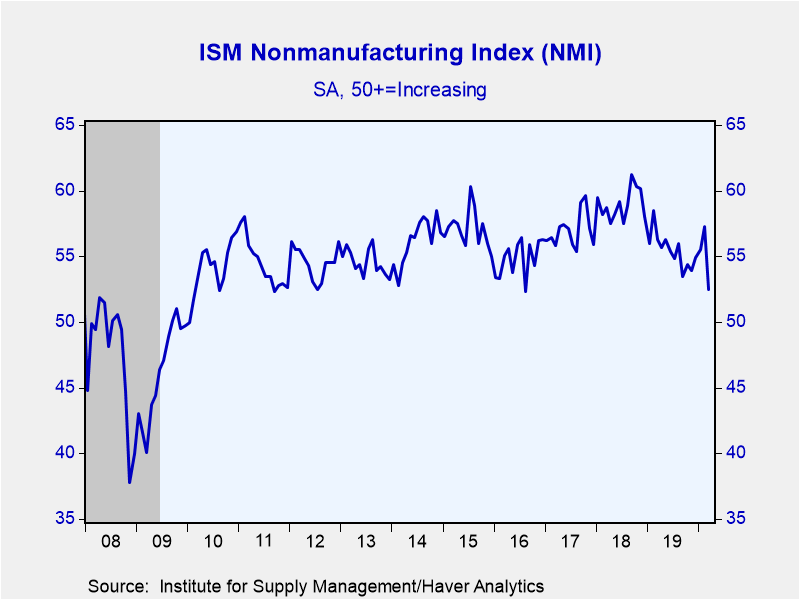
• ISM Nonmanufacturing index declined substantially less than expected to 52.5.
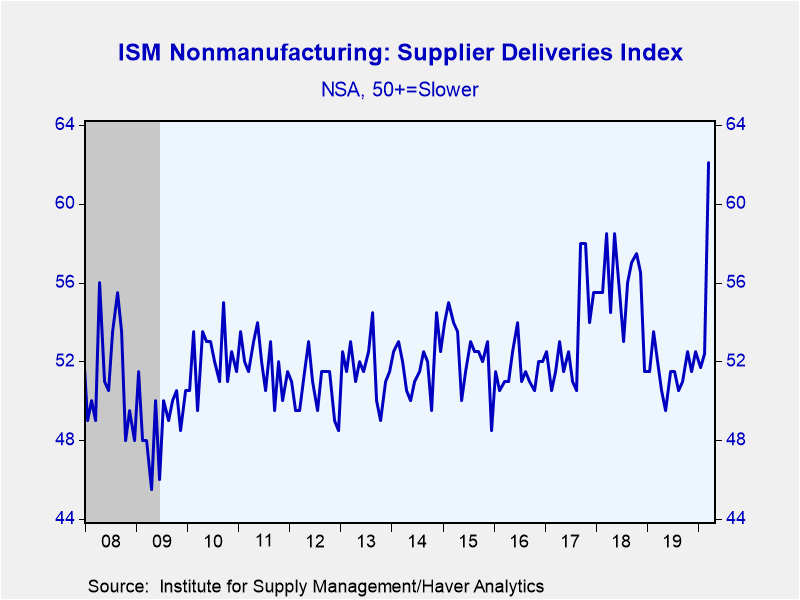
• COVID-19 related slowdown in supplier deliveries drove this reading.
• Slower supplier deliveries normally suggest economic strength, but in this case it is a sign of weakness.
The Composite Index of Nonmanufacturing Sector Activity from the Institute for Supply Management (ISM) decreased to 52.5 during March from 57.3 in February. The Action Economics Forecast Survey anticipated a drop to 46.0 in March.
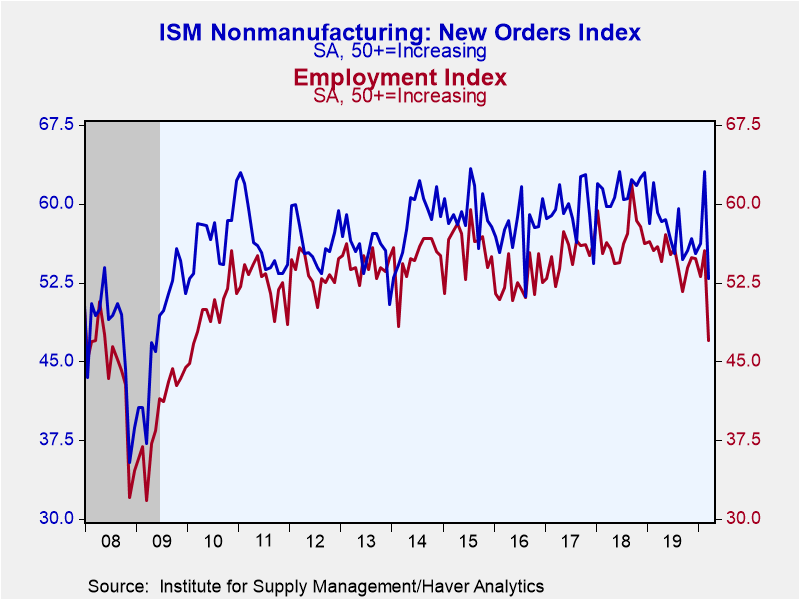
Business activity, new orders and employment measures all declined, with business activity and employment dropping below the 50-growth mark to levels not seen since 2009/10. However, the supplier delivery index jumped to 62.1 from 52.4, indicating substantially slower supplier deliveries. This measure is inverted since slower supplier deliveries are normally a sign of strength. However, in this case it is a reflection of COVID-19 related supply problems. Supplier deliveries also slowed meaningfully in 2008, during the Great Recession as credit constraints hampered business activity.
Haver Analytics constructs a composite index combining the nonmanufacturing and the manufacturing ISM, which was released on Wednesday. While the manufacturing index declined below the 50-growth mark to 49.1, it would have been meaningfully weaker had it not been for a similar jump in supplier deliveries. The composite index is based on GDP shares. Since nonmanufacturing makes up almost 90% of GDP, the March reading of the composite remained above 50.
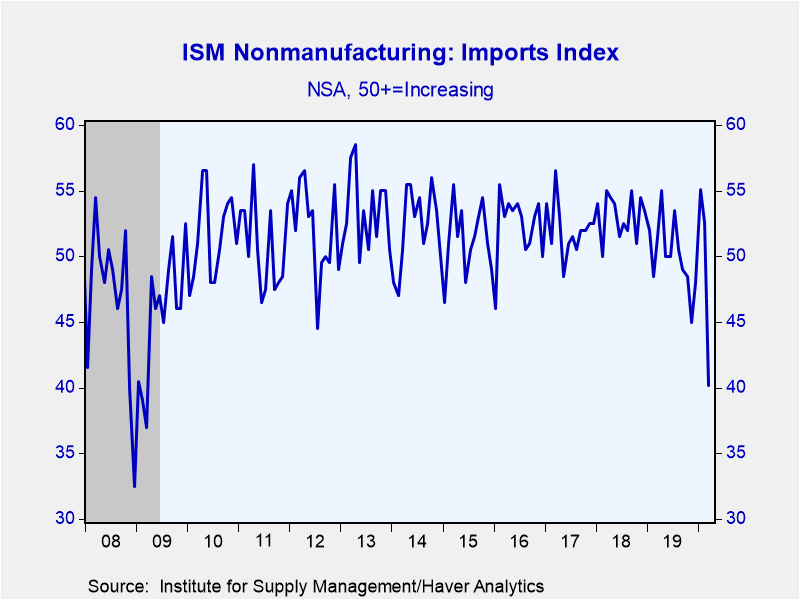
Both the export and import orders fell sharply, with the import measure dropping to levels not seen since early 2009, in the midst of the Great Recession. The prices index declined to 50.0 as the number of respondents indicating they were paying lower prices jumped to a four-year high 14.1%. These series are not included in the nonmanufacturing composite nor are they seasonally adjusted.
The ISM figures are available in Haver's USECON database, with additional detail in the SURVEYS database. The expectations figure from Action Economics is in the AS1REPNA database.
| ISM Nonmanufacturing Survey (SA) | Mar | Feb | Jan | Mar'19 | 2019 | 2018 | 2017 |
|---|---|---|---|---|---|---|---|
| Composite Diffusion Index | 52.5 | 57.3 | 55.5 | 56.3 | 55.5 | 59.0 | 56.9 |
| Business Activity | 48.0 | 57.8 | 60.9 | 58.0 | 58.0 | 61.7 | 60.2 |
| New Orders | 52.9 | 63.1 | 56.2 | 59.2 | 57.5 | 61.4 | 59.3 |
| Employment | 47.0 | 55.6 | 53.1 | 55.9 | 55.0 | 56.9 | 55.1 |
| Supplier Deliveries (NSA) | 62.1 | 52.4 | 51.7 | 52.0 | 51.5 | 55.8 | 53.2 |
| Prices Index | 50.0 | 50.8 | 55.5 | 57.5 | 57.6 | 62.1 | 57.7 |
| ISM Manufacturing and Nonmanufacturing Composite | 52.1 | 56.5 | 55.0 | 56.1 | 55.0 | 59.0 | 57.0 |
Gerald D. Cohen
AuthorMore in Author Profile »Gerald Cohen provides strategic vision and leadership of the translational economic research and policy initiatives at the Kenan Institute of Private Enterprise.
He has worked in both the public and private sectors focusing on the intersection between financial markets and economic fundamentals. He was a Senior Economist at Haver Analytics from January 2019 to February 2021. During the Obama Administration Gerald was Deputy Assistant Secretary for Macroeconomic Analysis at the U.S. Department of Treasury where he helped formulate and evaluate the impact of policy proposals on the U.S. economy. Prior to Treasury, he co-managed a global macro fund at Ziff Brothers Investments.
Gerald holds a bachelor’s of science from the Massachusetts Institute of Technology and a Ph.D. in Economics from Harvard University and is a contributing author to 30-Second Money as well as a co-author of Political Cycles and the Macroeconomy.


