 Global| May 05 2006
U.S. Job Growth Slowed, Wage Inflation Accelerated
by:Tom Moeller
|in:Economy in Brief
Summary
Nonfarm payrolls rose just 138,000 last month and the March increase was revised down to 200,000. The April gain fell short of Consensus expectations for a 200,000 rise. Private sector jobs were up 131,000, thus undershooting the new [...]
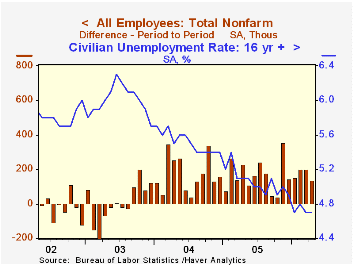
Nonfarm payrolls rose just 138,000 last month and the March increase was revised down to 200,000. The April gain fell short of Consensus expectations for a 200,000 rise.
Private sector jobs were up 131,000, thus undershooting the new ADP indicator for this subset which was issued Wednesday and had projected a 178,000 gain. The difference of 47,000 is somewhat less than that implied in the Consensus figure, while government employment, with a 7,000 rise, grew less than its recent average.
The 0.5% gain in average hourly earnings exceeded the Consensus expectation for a 0.3% rise and followed an upwardly revised 0.3% March increase. Factory sector earnings accelerated to 0.3% (1.9% y/y) following four consecutive months of 0.1% gain while private service-producing wages rose 0.6% (4.3% y/y). Professional & business services wages jumped 0.9% (5.8% y/y) and finance, insurance & real estate earnings increased 0.7% (4.3% y/y).
From the household survey the unemployment rate matched Consensus expectations and held steady at 4.7%. Employment rose just 47,000 (1.8% y/y) after a 384,000 surge during March while the labor force rose 159,000 (1.3% y/y).
The decline in teen labor force participation from the Federal Reserve Bank of Chicago is available here. 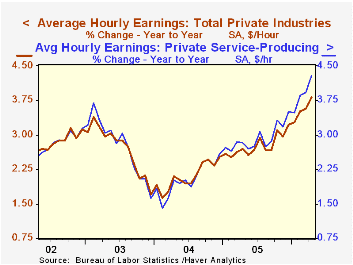
Payroll employment in private service-producing industries rose just 94,000 (1.7% y/y) last month following a downwardly revised 164,000 March rise. Jobs in retail trade reversed all of the prior month's increase with a 36,100 (+0.3% y/y) decline and job cutbacks were widespread. Financial sector jobs rose 26,000 (2.6% y/y) while professional & business services employment was similarly firm with a 28,000 (2.7% y/y) gain. Jobs in education & health rose 35,000 (2.4% y/y) while leisure & hospitality employment increased 20,000 (1.8% y/y).
Factory sector payrolls posted the best month of job gain in two years with a 19,000 April worker increase. Employment in the motor vehicles & parts industries rebounded 12,200 (-1.0% y/y) from earlier declines while computer & electronics payrolls rose 6,500 (0.9% y/y). However, the breadth of gain in factory payrolls over the last three months fell to 45.2% indicating broad based job loss.
Construction employment rose 10,000 (3.7% y/y) but government employment rose just 7,000 (0.6% y/y) following somewhat stronger gains during the prior two months.
"I always avoid prophesying beforehand because it is much better to prophesy after the event has already taken place." -- Winston Churchill
| Employment | April | Mar | Y/Y | 2005 | 2004 | 2003 |
|---|---|---|---|---|---|---|
| Payroll Employment | 138,000 | 200,000 | 1.5% | 1.5% | 1.1% | -0.3% |
| Manufacturing | 19,000 | 1,000 | -0.1% | -0.6% | -1.3% | -4.9% |
| Average Weekly Hours | 33.9 | 33.8 | 33.8 (April '05) | 33.8 | 33.7 | 33.7 |
| Average Hourly Earnings | 0.5% | 0.3% | 3.8% | 2.8% | 2.1% | 2.7% |
| Unemployment Rate | 4.7% | 4.7% | 5.1% (April '05) | 5.1% | 5.5% | 6.0% |
by Carol Stone May 5, 2006
Since 2003, the European Central Bank (ECB) has conducted a bank officers' lending survey similar to the Federal Reserve's "Senior Loan Officer Survey", asking questions about lending policies and credit demand experienced by banks. Results of the ECB survey taken in early April were reported today; we call your attention to them because, while we have felt some concern about European economic conditions (see our note yesterday about sluggish retail trade), it appears that credit conditions have been easing and that credit demand is picking up.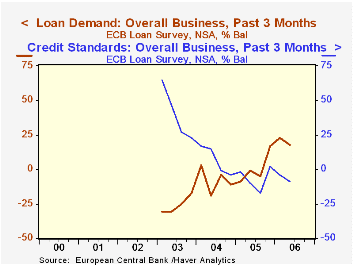
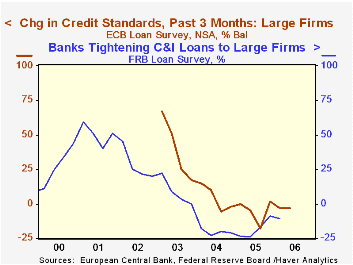
Taken in April, the survey reports that the number of banks easing credit standards for business loans had exceeded those tightening standards by 9 percentage points during the previous three months. The easing trend actually began in mid-2004 and has continued since, except for one quarter. This comes off a period of significant tightening during 2003, with a net of 65 percent of banks making credit criteria more stringent in the first survey in January 2003. Credit demand in that early period was weak, falling at a net of 31 percent of participating banks in the first half of 2003. Now, however, demand for business loans is picking up noticeably, with the latest three quarters averaging +19 percent.
In the table below, we include data for lending to large businesses and in the first graph we compare that to the Fed's series for US bank lending policies covering a comparable set of businesses. The trends are similar, as might well be for large firms, which can choose among financing institutions.
Similar credit policy patterns appear in the data on consumer and housing credit, although the cycle is much less pronounced. Consumer credit lending policies are marginally easier, loosening in the three months before the survey at a net of 5 percent of reporting institutions. This extends a slight easing trend that began in Q4 2004. Interestingly, demand for consumer credit appears strong, rising on balance at 21 and 18 percent of banks in the last two quarters, respectively. In light of recently lackluster retail sales, this bears comparison with actual consumer lending data, but that's a commentary for another day!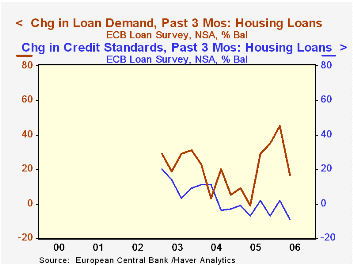
Meantime, demand for housing loans may have peaked. After three sharply positive quarters, reaching 45% in the January survey, the balance of banks with increased home purchase lending fell to 17% in this survey. Regarding credit standards, the behavior here is similar to consumer credit, with nearly neutral readings.
Obviously, all of these data want for lack of history, particularly through an entire business cycle. They should become more useful as that history builds. However, at this time, it seems that we can conclude that banks are increasingly willing to lend to businesses, and they are seeing some positive response in lending activity.
| Net Percentages: last 3 months | Q2 2006 | Q1 2006 | Q2 2005 | 2005 | 2004 | 2003 |
|---|---|---|---|---|---|---|
| Overall Business: Tighter Credit Standards | -9 | -4 | -10 | -7 | 7 | 40 |
| Credit Demand | 18 | 23 | -1 | 1 | -8 | -26 |
| Large Businesses: Tighter Credit Standards | -3 | -3 | -5 | -5 | 4 | 40 |
| Credit Demand | 17 | 10 | -6 | -4 | -7 | -21 |
| Consumer Credit: Tighter Standards | -5 | 1 | -7 | -3 | 1 | 15 |
| Credit Demand | 18 | 21 | 0 | 6 | 4 | -3 |
| Housing Loans: Tighter Standards | -9 | 2 | -7 | -3 | 4 | 12 |
| Credit Demand | 17 | 45 | -1 | 18 | 13 | 27 |

Tom Moeller
AuthorMore in Author Profile »Prior to joining Haver Analytics in 2000, Mr. Moeller worked as the Economist at Chancellor Capital Management from 1985 to 1999. There, he developed comprehensive economic forecasts and interpreted economic data for equity and fixed income portfolio managers. Also at Chancellor, Mr. Moeller worked as an equity analyst and was responsible for researching and rating companies in the economically sensitive automobile and housing industries for investment in Chancellor’s equity portfolio. Prior to joining Chancellor, Mr. Moeller was an Economist at Citibank from 1979 to 1984. He also analyzed pricing behavior in the metals industry for the Council on Wage and Price Stability in Washington, D.C. In 1999, Mr. Moeller received the award for most accurate forecast from the Forecasters' Club of New York. From 1990 to 1992 he was President of the New York Association for Business Economists. Mr. Moeller earned an M.B.A. in Finance from Fordham University, where he graduated in 1987. He holds a Bachelor of Arts in Economics from George Washington University.
More Economy in Brief

 Global| Feb 05 2026
Charts of the Week: Balanced Policy, Resilient Data and AI Narratives
by:Andrew Cates

