 Global| Jan 26 2012
U.S. Leading Indicators Revamped; Index Suggests Continuing Improvement in Economy
Summary
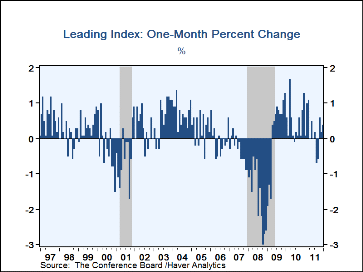
The Conference Board's revised leading indicator index ("LEI") rose 0.4% in December, following 0.2% in November. For all of 2011, the index was up 2.8% December/December and 5.1% on average for the year over 2010. Despite the [...]
The Conference Board's revised leading indicator index ("LEI") rose 0.4% in December, following 0.2% in November. For all of 2011, the index was up 2.8% December/December and 5.1% on average for the year over 2010. Despite the December pick up, however, the monthly result fell short of consensus forecasts that had projected 0.7%. Of the 10 components, 7 contributed to the rise in the index, two were negative and one was flat with November; December's broad-based gain marked a third consecutive month when 60-70% of the components firmed, a distinct improvement from the spring and summer months when the positive push was as low as 25% and 30%. The content of the leading index was also changed with this report; see below for more detail on the individual components.
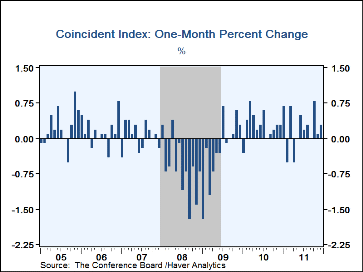
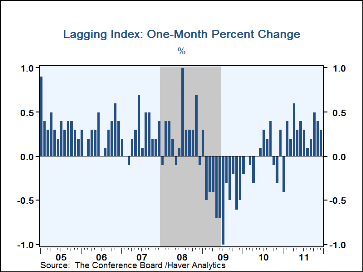
The accompanying coincident indicators, employment, personal income, industrial production and manufacturing & trade sales, which describe the current state of the economy, rose 0.3% in December, a modest pick-up from November's 0.1% increase. All four items contributed to the latest increase, with business sales and personal income tracing a firming path relative to the sluggishness of the summer. The lagging index also rose 0.3%, continuing a steady uptrend. Of its seven items, four made positive contributions, the average duration of unemployment, unit labor cost in manufacturing, consumer credit and the CPI for services. The ratio of the coincident to lagging indicators, which sometimes leads the leading index, remained flat at 91.2, extending the largely flat pattern that has prevailed since April.
This report included annual benchmark revisions for all of these indexes. The Conference Board combines the components using a numerical normalization procedure that accounts for the varying volatility of each item; these volatility factors are updated once a year in addition to revisions in the underlying data. This is a routine operation.
In addition this year, Conference Board analysts conducted the first comprehensive reexamination of the leading index since they assumed production responsibility for these series from the U.S. Commerce Department in 1996. Clearly the structure of the U.S. economy has changed in these 16 years. The Conference Board's analysts devised a method for the systematic analysis of the cyclicality of a vast number of indicators of all kinds. They tested combinations of these to see which ones might do a more reliable job predicting turns in the broader economy. An early clue that these procedures would be beneficial came from the fact that the overall leading index omitting the real M2 item performed more reliably after 1990 than the index itself.
The structural revisions are thus twofold. A completely new financial conditions indicator was compiled, which they call the "leading credit index" or LCI. This is a composite of factors involving credit spreads, credit availability and investor sentiment measures. It replaces real M2 in the index beginning in May 1990. The LCI joins the yield curve measure (the 10-year Treasury yield spread over Fed funds) and stock prices (the S&P 500 index) in describing financial forces on the economy. Otherwise, three real sector indicators were altered. Manufacturers orders for nondefense capital goods were modified to exclude aircraft, which has a highly variable lead-time. The ISM vendor performance index, originally meant as a proxy for capacity utilization, was replaced with the ISM's new orders index, which is clearly a precursor to developments in utilization, and the measure of consumer expectations was changed from the broad Michigan survey expectations index to a combination of the Michigan subindex covering consumer expectations for business conditions in 12 months with the Conference Board's own survey item of consumer expectations for the economy out six months.
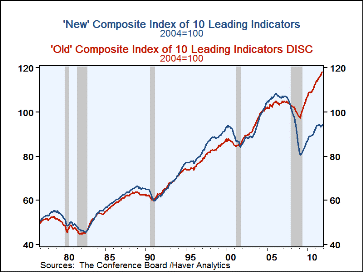
The result is an index that in fact has longer lead-times at business cycle peaks and which fell more steeply during the latest recession. Further, the new index even now remains well below its early-2006 peak, while the old index achieved a new peak in the fall of 2009. The latter outcome contrasts with impressions of the overall condition of the economy.
The Conference Board figures are available in Haver's BCI database; the components are available there, and most are also in USECON. The forecast figure is the Consensus in the AS1REPNA database. Visit the Conference Board's site for coverage of leading indicator series from around the world.
| Business Cycle Indicators (%) | Dec | Nov | Oct | Y/Y | 2011 | 2010 | 2009 |
|---|---|---|---|---|---|---|---|
| Leading | 0.4 | 0.2 | 0.6 | 2.8 | 5.1 | 7.6 | -12.8 |
| Old Leading index | -- | 0.5 | 0.9 | 5.9(Nov) | -- | 7.8 | 0.3 |
| Coincident | 0.3 | 0.1 | 0.8 | 2.6 | 2.8 | 2.5 | -7.7 |
| Lagging | 0.3 | 0.5 | 0.9 | 3.2 | 1.8 | -2.9 | -1.9 |
Carol Stone, CBE
AuthorMore in Author Profile »Carol Stone, CBE came to Haver Analytics in 2003 following more than 35 years as a financial market economist at major Wall Street financial institutions, most especially Merrill Lynch and Nomura Securities. She has broad experience in analysis and forecasting of flow-of-funds accounts, the federal budget and Federal Reserve operations. At Nomura Securites, among other duties, she developed various indicator forecasting tools and edited a daily global publication produced in London and New York for readers in Tokyo. At Haver Analytics, Carol is a member of the Research Department, aiding database managers with research and documentation efforts, as well as posting commentary on select economic reports. In addition, she conducts Ways-of-the-World, a blog on economic issues for an Episcopal-Church-affiliated website, The Geranium Farm. During her career, Carol served as an officer of the Money Marketeers and the Downtown Economists Club. She has a PhD from NYU's Stern School of Business. She lives in Brooklyn, New York, and has a weekend home on Long Island.


