 Global| Jun 01 2012
U.S. Personal Income Growth Eases, While PCE Picks Up
Summary
Personal income increased 0.2% (2.8% y/y) in April after 0.4% March, which was unrevised from the initial report last month and modestly weaker than consensus expectations for 0.3%. The April rise included a 0.2% rise (3.2% y/y) in [...]
 Personal income increased 0.2% (2.8% y/y) in April after 0.4%
March, which was unrevised from the initial report last month and modestly
weaker than consensus expectations for 0.3%. The April rise included a 0.2%
rise (3.2% y/y) in wages and salaries, a second month of slowing after
some improvement in the winter. Wages and salaries were also revised
somewhat beginning in Q4 2011, due to a regular quarterly updating of the
Labor Department source data. Among other income categories, rental income
surged 1.0% (14.2% y/y), a tenth consecutive monthly gain of 1% or more.
Proprietors' income increased 0.4% (3.1% y/y). Low interest rates
meant that interest income was flat in April, following three months of
0.6% increases; the year-on-year movement was down 1.8%. In contrast, dividend
income remained strong, rising 1.0% in April and 6.5% from a year ago.
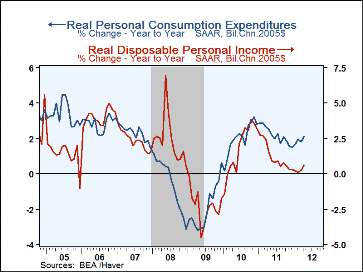
Personal consumption expenditures picked up to a 0.3% increase in April from an upward revised 0.2% rise in March, which was originally reported at 0.1%; April's year/year gain was 4.0%. The April number was in line with consensus forecasts. Durable goods purchases rose 0.6%, resuming growth after a 1.4% decrease in March. The swing was led by a renewed increase in motor vehicles; other major durables, including home furnishings and recreational goods, declined or slowed in April from March. Spending on nondurable goods fell 0.2% in April after rising 0.9% in March; this swing owed mainly to declining gasoline prices and a lower volume of clothing purchases. Outlays for services increased 0.4% (+3.6% y/y) following 0.3% in April; expenditures on housing had an upswing of 0.9% after their 0.2% decrease in March, while recreational services weakened. Food services (i.e., mostly restaurant meals) and accommodations inched up 0.1% in April, but they had surged 1.1% in March.
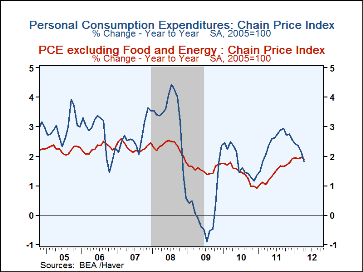
The PCE chain price index was flat in April after a 0.2% increase in March; it is up 1.8% from a year ago. The April flattening came mainly from a decline in energy goods and services of 1.8%; those prices are now down 0.4% from a year earlier. The core PCE price index was also a bit slower in April, with a 0.1% increase following March's 0.2%; it is 1.9% above a year ago. The flat price index means that the real value of PCE in April also rose, as did the nominal, by 0.3%, picking up from a flat performance in March, revised from 0.1% reported before.
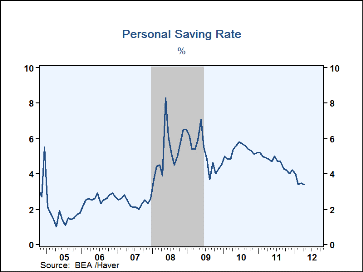
The personal saving rate was 3.4% in April, down from March's 3.5%, revised down from 3.8% reported last month, reflecting the upward revision to March spending. A year ago, the saving rate was 4.8%.
The personal income & consumption figures are available in Haver's USECON and USNA databases. The consensus expectations figures are in the AS1REPNA database.
| Personal Income & Outlays(%) | April | Mar | Feb | Jan | Y/Y | 2011 | 2010 | 2009 |
|---|---|---|---|---|---|---|---|---|
| Personal Income | 0.2 | 0.4 | 0.3 | 0.3 | 2.8 | 5.0 | 3.7 | -4.3 |
| Wages & Salaries | 0.2 | 0.3 | 0.4 | 0.4 | 3.2 | 4.1 | 2.2 | -4.3 |
| Disposable Personal Income | 0.2 | 0.4 | 0.3 | 0.2 | 2.4 | 3.7 | 3.6 | -2.1 |
| Personal Consumption Expenditures | 0.3 | 0.2 | 0.9 | 0.4 | 1.8 | 4.7 | 3.8 | -1.7 |
| Personal Saving Rate | 3.4 | 3.5 | 3.4 | 4.0 | 4.8 (Apr.'11) |
4.6 | 5.3 | 5.1 |
| PCE Chain Price Index | 0.0 | 0.2 | 0.3 | 0.2 | 1.8 | 2.5 | 1.8 | 0.2 |
| Less Food & Energy | 0.1 | 0.2 | 0.1 | 0.2 | 1.9 | 1.4 | 1.4 | 1.6 |
| Real Disposable Income | 0.2 | 0.2 | -0.0 | -0.0 | 0.6 | 1.2 | 1.8 | -2.3 |
| Real Personal Consumption Expenditures |
0.3 | 0.0 | 0.6 | 0.2 | 2.1 | 2.2 | 2.0 | -1.9 |
Carol Stone, CBE
AuthorMore in Author Profile »Carol Stone, CBE came to Haver Analytics in 2003 following more than 35 years as a financial market economist at major Wall Street financial institutions, most especially Merrill Lynch and Nomura Securities. She has broad experience in analysis and forecasting of flow-of-funds accounts, the federal budget and Federal Reserve operations. At Nomura Securites, among other duties, she developed various indicator forecasting tools and edited a daily global publication produced in London and New York for readers in Tokyo. At Haver Analytics, Carol is a member of the Research Department, aiding database managers with research and documentation efforts, as well as posting commentary on select economic reports. In addition, she conducts Ways-of-the-World, a blog on economic issues for an Episcopal-Church-affiliated website, The Geranium Farm. During her career, Carol served as an officer of the Money Marketeers and the Downtown Economists Club. She has a PhD from NYU's Stern School of Business. She lives in Brooklyn, New York, and has a weekend home on Long Island.


